Greenhouse gas emissions and COP negotiation strategies
2015
This article is about the different greenhouse gases and what appears to be a delaying COP negotiation strategy on the road to a potentially very costly global greenhouse gas reduction agreement. The essential climate change problem (as I see it) is the greenhouse gas emissions related to fossil fuels. As an example, around 82% of all anthropologic greenhouse gases in the United States are related to coal, oil or natural gas. This measure includes emissions of three different greenhouse gases: carbon dioxide (CO2), methane (CH4) and nitrous oxide (N2O).
Since 1990 the atmospheric concentrations of these three gases has increases by around 13% (carbon dioxide), 7% (methane) and 6% (nitrous oxide). However, the three gases are also emitted from other sources than fossil fuels, including many natural sources … in addition, the potent synthetic fluorinated gases (F-gases) are not related to fossil fuels at all. On a global scale the overall picture is extremely complicated. Note that water vapor is the dominant greenhouse gas among all, but it is not considered relevant to the anthropogenic global warming – and therefore water vapor is usually not regarded as a greenhouse gas.
These are the headlines of the succeeding sections:
- How to compare the global warming effect of greenhouse gases.
- The sources and climate impact of the greenhouse gases.
- Is this mishmash deliberately used to delay the COP negotiations?
How to compare the global warming potential of greenhouse gases
The Global Warming Potential (GWP) of 1 ton of carbon dioxide, over a given period, is set at 1 (this serves as a baseline for other greenhouse gases). The GWP of 1 ton of methane, over a 100-year period, is 21, which means that methane causes 21 times as much global warming as one ton of carbon dioxide. When it is said:”Methane emissions were 100 million tons of carbon dioxide equivalents” (MTCE = Metric Tons Carbon Equivalent), it means that the mass of methane emitted is equivalent to 100 million tons of carbon dioxide, in terms of Global Warming Potential (usually a 100-year GWP).
However, if the “100-year GWP” is replaced with a “20-year GWP” the GWP of methane is 56; or a “500-year GWP” which provides methane with a GWP of only 6.5. The changed outcome is due to different life-circles of carbon dioxide and methane: Changes in the atmospheric concentrations of carbon dioxide persist for thousands of years1 whereas methane lasts for only about 14 years, on average. Comparable data of other greenhouse gases are available in the following section.
The sources and global warming potential of the greenhouse gases
In the following review, the greenhouse gas emissions related to fossil fuels are red, anthropologic emissions not related to fossil fuels are blue and natural sourced emissions are green (part of the Earth’s natural cycle’s). The significance of the subdivision into three categories is analyzed in the last section.
Carbon dioxide (CO2)
♦ 100-year GWP: 1.
♦ Life-time in atmosphere: poorly defined; changed concentrations persist for thousands of years1.
- Burning fossil fuels (around 87% of the global anthropologic carbon dioxide emissions are from burning of fossil fuels).
- Deforestation (including forest-fires) and other land use changes (the natural environment is converted into areas for human use like agricultural land, livestock or settlements).
- Industrial processes (carbon dioxide is a byproduct of chemical reactions associated with production of cement, metals, chemicals etc.).
- Burning of solid waste (biomass).
- Decay of organic waste in landfills.
- The oceans (ocean-atmosphere exchange).
- Decay of organic materials.
- Plants including roots (forests are dominant).
- Animals.
- Microorganisms.
- Fungi.
- Natural wildfires (including forest-fires).
- Volcanoes.
Methane (CH4)
♦ 100-year GWP: 21.
♦ Life-time in atmosphere: 14 years on average.
- Production and transport of fossil fuels (around 33% of global anthropologic methane emissions are related to fossil fuels).
- Livestock (enteric fermentation in farm animals).
- Agricultural practices (rice agriculture is dominant).
- Decay of organic waste in landfills.
- Burning of solid waste (biomass).
- Biofuels (including open cooking fires etc.).
- Wetlands (with microbes which require organic material in an environment with no oxygen).
- Termites (digestion).
- Microorganisms.
- The oceans (microorganisms in deeper sediment are dominant).
- Wildfires (including natural forest-fires).
Nitrous oxide (N2O)
♦ 100-year GWP: 300.
♦ Life-time in atmosphere: 114 years on average.
- Combustion of fossil fuels (the global share of the total anthropologic emissions is probably a few percentages (with high uncertainty) – however, for example in the United States 12% of the anthropologic nitrous oxide emissions were related to fossil fuels in 2013).
- Combustion of solid waste.
- Agricultural activities (synthetic fertilizer is dominant).
- Livestock manure and urine.
- Poultry and dairy farms.
- Wastewater.
- Industrial processes (byproduct related to production of synthetic commercial fertilizer, nylon and other synthetic products). One source² suggests that: “Nitrous oxide is generally emitted from industry through fossil fuel combustion.”
- Soils under natural vegetation (microorganisms etc.).
- Animal manure and urine.
- The oceans (microorganisms are dominant).
Fluorinated gases (F-gases)
F-gases are a range of synthetic (no natural sources), potent greenhouse gases that are emitted from a variety of industrial processes. Below are the four main categories in which there are numerous subgroups.
Hydrofluorocarbons (HFC)
♦ 100-year GWP: 12-14,800.
♦ Life-time in atmosphere: 1-270 years.
These chemicals were developed as a replacement for chlorofluorocarbons (CFCs) and hydrochlorofluorocarbons (HCFCs) because they do not deplete the stratospheric ozone layer. They are released into the atmosphere through leaks, servicing, and disposal of equipment.
- Refrigerants, for example in air conditioning systems in vehicles and buildings.
- Aerosol propellants.
- Solvents.
- Fire retardants.
Perfluorocarbons (PFC)
♦ 100-year GWP: 7,390-12,200.
♦ Life-time in atmosphere: 2,600-50,000 years
- By-product from aluminum production.
- By-product from manufacturing of semiconductors.
Sulfur hexafluoride (SF6)
♦ 100-year GWP: 22,800.
♦ Life-time in atmosphere: 3,200 years.
- Magnesium processing.
- Processing semiconductor manufacturing.
- A tracer gas for leak detection.
- Transmission and distribution of electricity.
- In electrical transmission equipment, including circuit breakers.
Nitrogen trifluoride (NF3)
♦ 100-year GWP: 17,200.
♦ Life-time in atmosphere: 740 years.
- Etchant in microelectronics.
- Etchant in silicon wafers.
- Production of liquid-crystal displays.
- Production of silicon-based solar cells.
- Used in curtain types of chemical lasers.
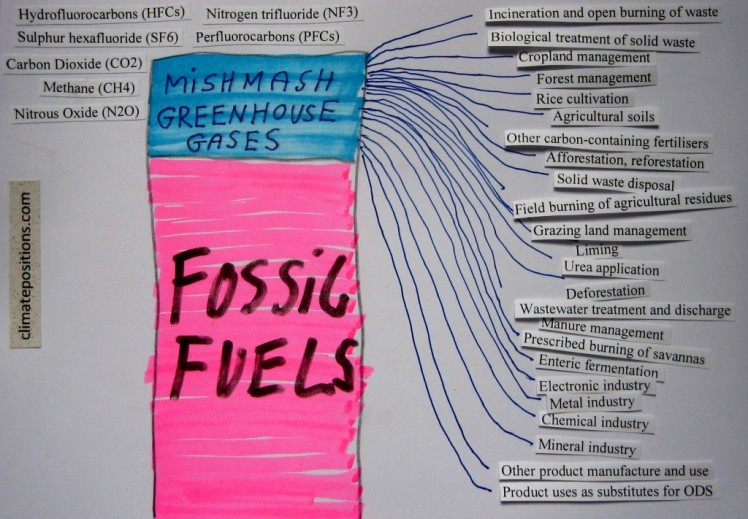
Is this mishmash deliberately used to delay the COP negotiations?
The ‘COP-submissions’ by March 2015, make no assurances regarding the exact reduction rates of fossil fuel greenhouse gas emissions (red category). What the submissions do express, are voluntary intentions to overall emission reductions among all the greenhouse gases reviewed above and among all the sources of anthropological greenhouse gas emissions (red and blue categories combined). How the intended greenhouse gas reductions will be implemented and controlled – under these extremely complicated circumstances (a blend of red, blue and green) – is beyond me. To illustrate the absurdity of this discouraging mishmash-approach, the ‘Russian submission’ is used as a case:
Russia is the 4th largest emitter of CO2 from fossil fuels and per capita emissions were 12.9 tons in 2012, or 13% higher than in the 1990s. Now, Putin’s intentions are to reduce greenhouse gas emissions by at least 25% by 2030 compared to 1990. However, contributions of the Russian forests will be, quote (in translation): “…fully taken into account.” And, quote: “Rational use, protection, maintenance and forest reproduction, i.e. forest management, is one of the most important elements of the Russian policy to reduce greenhouse gas emissions.” The Russian forest cover is stable at 49% of the total area, the population density is one-sixth of the world’s average and the Russian territory is the size of China and Australia combined. How will it be possible to verify greenhouse gas reductions due to changes in “forest management” in such huge and sparsely populated areas? One may also ask: Does Putin intends to reduce greenhouse gas emissions from fossil fuels by 2030, at all?
Similar greenhouse gas reduction verification problems worldwide are apparent with regard to agricultural practices, livestock, poultry and dairy farms, landfills, wastewater, industrial processes, leaks of F-gases etc. By mingling all these (important but extremely complicated) emission issues with reductions from fossil fuels, the latter is blurred and downgraded. The result is likely to become a depressingly inadequate global climate agreement at COP-21 in Paris in November-December 2015. Had there been genuine willingness among the major fossil fuel countries, to phase out coal, oil and gas, this issue would have been confronted in a separate global fossil fuel agreement, decades ago (CO2 Emissions from fossil fuels is a fairly workable key-indicator). The other sources of anthropologic emissions are different in nature and circumstances and require various approaches.
Around three-quarter of the anthropogenic global warming is due to burning of fossil fuels. Atmospheric concentrations of CO2 have increased from 317 ppm in 1960 to around 400 ppm in 2015 and the changed concentrations will persist for thousands of years. If the mishmash-approach is a deliberate delaying COP-strategy it has been remarkably successful!
1 Carbon dioxide’s lifetime is poorly defined because the gas is not destroyed over time, but instead moves between different parts of the atmosphere, ocean and land (read about the ‘carbon cycle’).
² ‘http://epa.gov/climatechange/ghgemissions/gases.html‘
In ClimatePositions the current Russian Climate Debt is $202 billion. The Climate Debt is calculated on the basis of ‘twelve indicators’ among which CO2 Emissions from fossil fuels per capita is principal. If Russia paid its Climate Debt to a fair (non-existing) global climate fund, the authoritarian regime (like other Climate Debt Free countries; see the ‘ranking’) could apply for funding aimed at all kinds of greenhouse gas reduction projects, including forest management projects.
.
About greenhouse gases: ‘http://epa.gov/climatechange/ghgemissions/‘.
About greenhouse gases: ‘http://whatsyourimpact.org/greenhouse-gases‘.
Source on CO2 Emissions: EIA, U.S. Energy Information Administration (links in the menu “Calculations”).
Source on CO2 Content in the atmosphere: NOAA Earth System Research Laboratory (links in the menu “Calculations”).
Sources on national forest cover and primary forests: United Nations (UN) (links in the menu “Calculations”).
COP Submissions since March 2015: ‘http://www4.unfccc.int/submissions/indc/Submission%20Pages/submissions.aspx‘
Drawing by Claus Andersen, 2015 (the words are from EU’s submission by March 2015).
Comments are closed.