Nuclear Power updates 2014

2015
The world’s Nuclear Power generation increased by 2.2% in 2014 compared to 2013. The six largest nuclear producers United States, France, Russia, South Korea, China and Canada increased generation by 4.0%, while the rest of the world reduced generation by 3.9%.
The same six Nuclear Power countries, representing 28% of the world’s population, are responsible for 54% of the global CO2 Emissions from fossil fuels and 60% of the global Climate Debt (see the ‘ranking’).
The last five years of generated global nuclear electricity was:
- 2010: 2,629 billion kWh
- 2011: 2,516 billion kWh
- 2012: 2,346 billion kWh
- 2013: 2,359 billion kWh
- 2014: 2,411 billion kWh
The Nuclear Power generation in 2013 and 2014 of all countries is available ‘here’ and diagrams with per capita generation since 2000 are available in the menu ‘Calculations (Excel)’. Read more in the article ‘Nuclear Power updates 2013’.
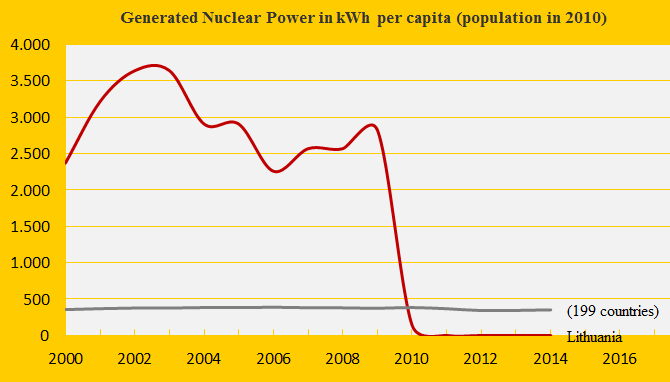
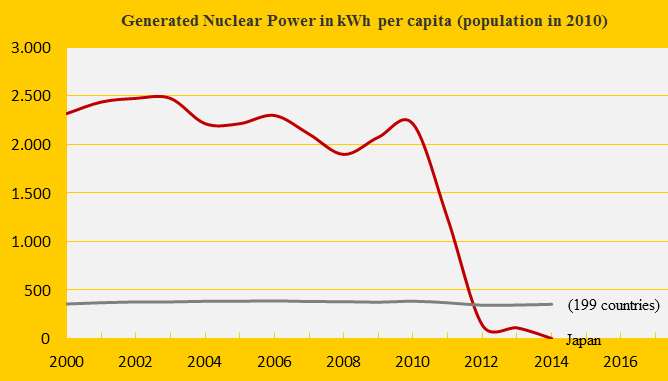
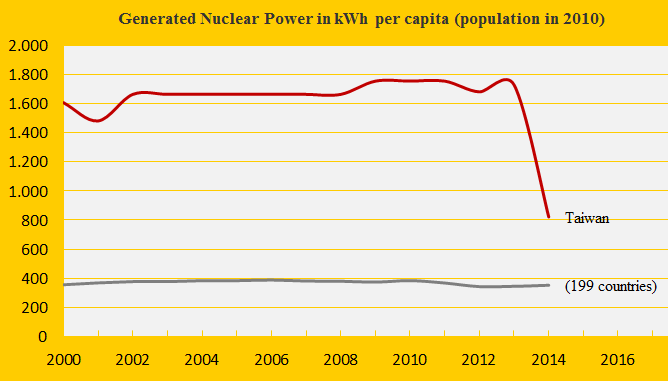
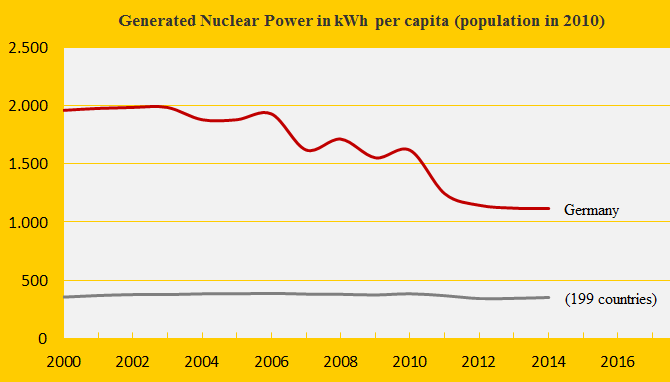
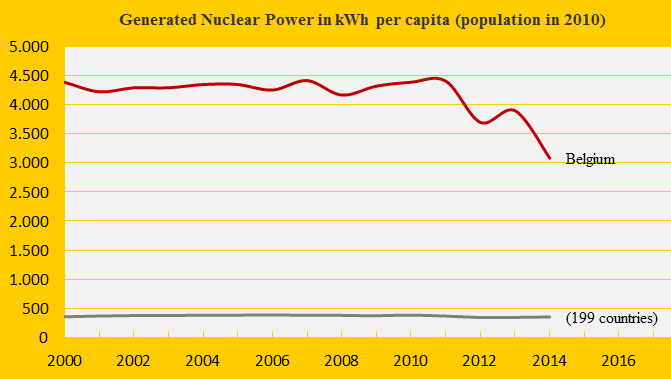
Below are shown five instructive phasing out graphs to inspire other radioactive countries:
.
Data on national Nuclear Power generation: World Nuclear Association (links in the menu “Calculations”).
Nuclear waste image by Claus Andersen, 2015.
Comments are closed.