Slowdown of Denmark’s accumulating Climate Debt, but..!
2015
Denmark’s updated Climate Debt is $806 per capita. In the latest ‘ranking’ the Scandinavian country is 41st out of 147 countries (where no. 1 is worst) and is often referred to as a green transition pioneer. However, according to various rankings and surveys the picture is somewhat more complicated:
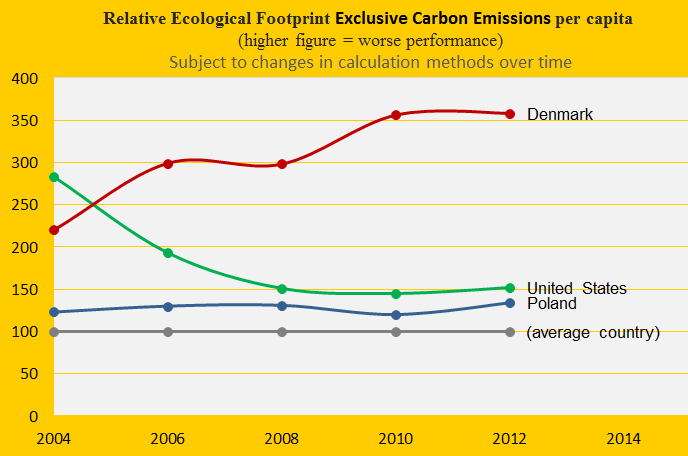
- Denmark’s per capita ‘Ecological Footprint’ – without carbon emissions – is the largest among 152 countries.
- Denmark is ranked 1st among 29 countries (those with data) on organic (ecological) share of all domestic sales¹.
- In the ‘Climate Change Performance Index’ (from Germanwatch and Climate Action Network Europe) Denmark performs best of 58 countries.
- CO2 Emissions would be around 46% higher than the usual statistics show, if emissions from Danish-controlled overseas ships, sailing goods around the world, were included² (in 2011 the Danish per capita CO2 Emissions would be around 15.0 tons instead of 8.2 tons).
- In addition, Denmark’s CO2 Emissions would be around 18% higher (in 1996-2009), than the usual statistics show, if emissions were consumption-based³ (inclusive CO2 Emissions from the production of imported goods) instead of production-based (inclusive CO2 Emissions from domestic production of goods for export).
However, the following examines only the indicators of CO2 Emissions from fossil fuels (production-based and without emissions from overseas ships), GDP(ppp-$) and Ecological Footprint without carbon emissions.
The first diagram (below) shows Denmark’s CO2 Emissions per capita in decades. The green bars are the Contribution Free Level and the grey bars are the world average. The Danish reduction rate is world-class – in a world with no class.
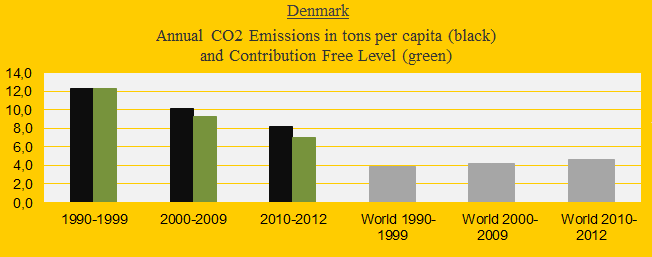
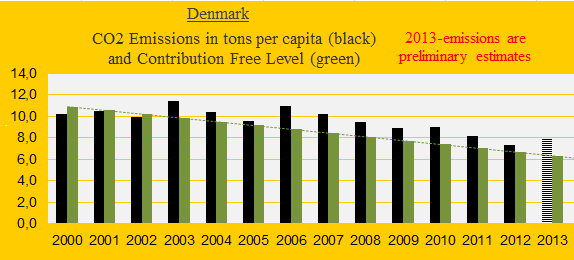
Except from a setback between 2003 and 2007 the Danish CO2 Emissions per capita has decreased almost in an acceptable rate (see the diagram below). The total amount of exceeded CO2 Emissions per capita since 2000 is 13.1 tons – the exceeded emissions are the basis of the calculation of the national Climate Debt. Note that 2013-emissions are preliminary estimates. The Danish top ranking in ‘Climate Change Performance Index’ (2014) is justified as follows, quote: “Their success is based on a positive development in recent emissions and an exceptionally good policy evaluation.” Read also this ‘article’ and the case-story “Winds of Change” in ‘Living Planet Report’ (pdf p. 124).
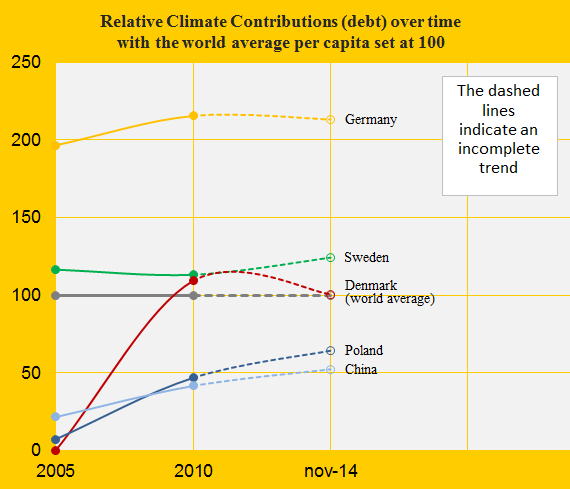
The diagram below shows the relative Climate Debt per capita since 2005 of Denmark, Germany, Sweden, Poland and China, with the world average set at 100. The Danish drop in performance between 2003 and 2007 is striking (the per capita Climate Debt increased from $0 in 2005 to $497 in 2010) and the recovery since 2010 likewise.
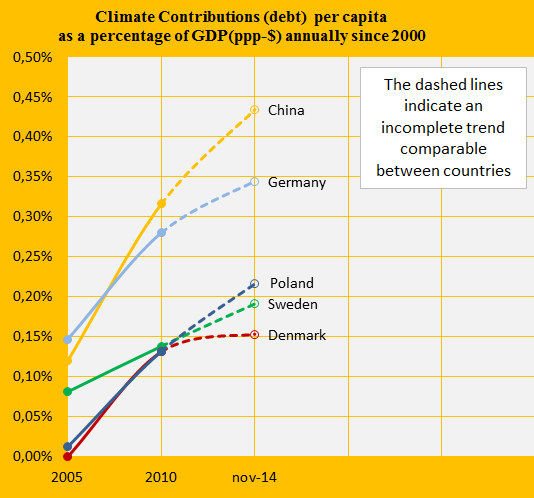
The Climate Debt calculated as percentages of the GDP(ppp-$) annually since 2000, of the same five countries, are shown in the diagram below. Among these countries the Danish performance since 2010 stands out. See the ‘ranking’ (Denmark were 58th in 2010 and 62nd in 2014). Denmark switched government in 2011.
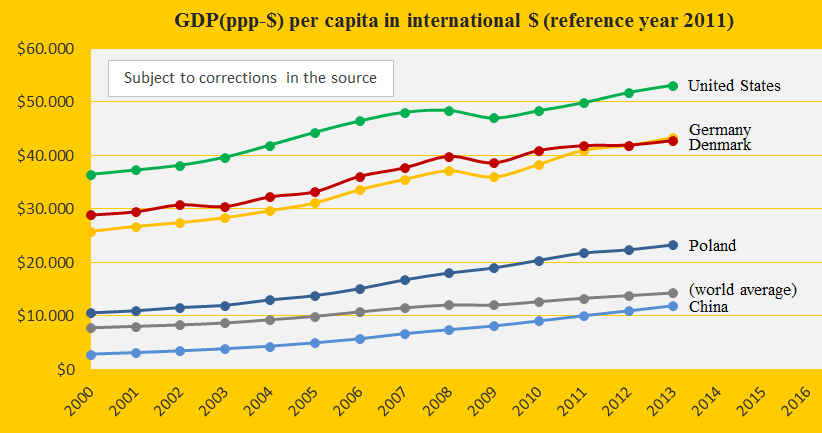
The GDP(ppp-$) per capita since 2000 of Denmark, the United States, Germany, Poland, China and the world average, is shown in the diagram below. Germany passed Denmark recently.
The relative Ecological Footprints without carbon emissions per capita of Denmark, the United States and Poland, compared to an average country set at 100, are shown in the diagram below. Note that 1.5 earths are required today to meet the human demands on nature (read this ‘article’). If carbon emissions are included in the calculation Denmark is 4th after Kuwait, Qatar and United Arab Emirates. The extremely large Danish footprint is due to cropland (36%), carbon (27%), forest products (14%), grazing products (12%), fishing grounds (8%) and built-up land (3%). Read more in the article ‘WWF: Denmark has world’s fourth largest ecological footprint’. Only 0.6% of Denmark is covered by the precious Primary Forests.
Denmark’s total Climate Debt accumulated since 2000 is $4.5 billion ($806 per capita) but if the Ecological Footprint without carbon emissions were as the world average, then the Climate Debt would be only $1.9 billion ($346 per capita).
¹The Danish domestic organic sale were 7.6% of all sales in 2012 (7.0% in 2009). Data on 29 countries is available ‘here’ (in the Excel under the heading: Domestic market and international trade data).
²CO2 Emissions from Danish-controlled overseas ships: Article (in Danish) from Dagbladet Information: ‘Skibet er ladet med klimakontrovers’.
³Consumption-based CO2 Emissions in Denmark: The Rockwool Foundation, 2014: ‘Measuring Denmark’s CO2 Emissions 1996–2009’.
.
Source on CO2 Emissions: EIA, U.S. Energy Information Administration and data on preliminary national CO2 Emissions are from Global Carbon Project (links in the menu “Calculations”).
Source on Ecological Footprint: WWF reports “The Living Planet” published 2006-2014 (links in the menu “Calculations”).
Information on national GDP(ppp-$) per capita: Worldbank (links in the menu “Calculations”).
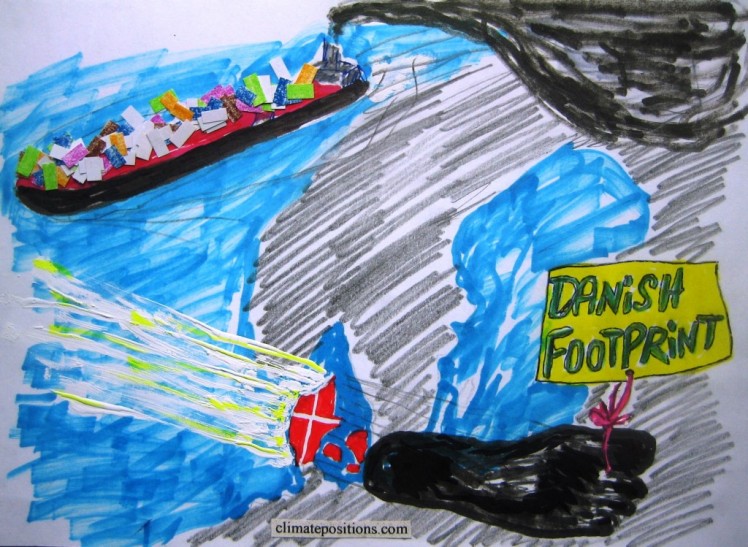
Drawing by Claus Andersen, 2015.
Comments are closed.