South Africa – the world’s 13th largest CO2 emitter (coal, coal and more coal … and inequality)
South Africa populates 0.7% of the planet’s people and emits 1.3% of the world’s CO2 from fossil fuels (without bunkers) and cement production. The Climate Debt of the 54 million South African’s amounts to $39 billion, or $720 per capita, and the ‘Ranking’ was 42nd among 148 countries by January 2016 – in 2010 the ranking was 45th.
The first diagram shows South Africa’s per capita CO2 Emissions from fossil fuels (without bunker fuels) and cement production in decades in comparison with the world average. CO2 Emissions 2012-2014 are preliminary estimates. The green bars are the Contribution Free Level, determined by the level of CO2 Emissions in the 1990s and a number of continuously updated ‘Indicators’.
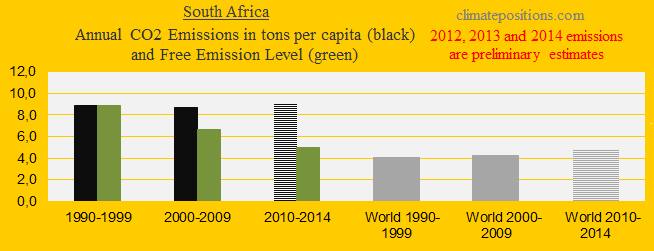
The second diagram shows the per capita CO2 Emissions from fossil fuels (without bunker fuels) and cement production since 2000. CO2 Emissions in 2012, 2013 and 2014 are preliminary estimates. The emissions from coal alone accounted for about 81% of the total emissions in 2012 (preliminary), only surpassed by North Korea’s 85%. See the table in the article ‘Climate Debt: Australia ranks 8th (performance of the twenty largest coal producers)’.

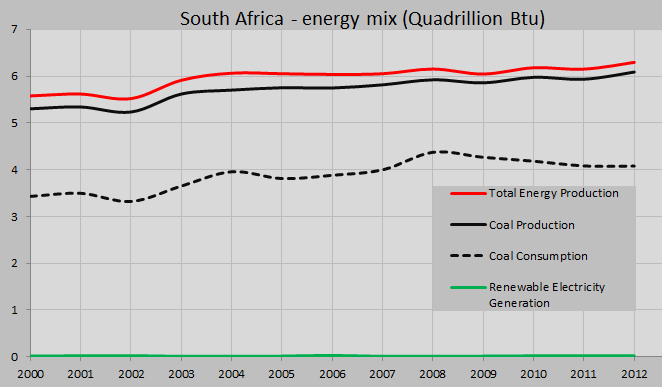
In 2012 South Africa accounted for 3.7% of the world’s coal production (ranked 7th). The diagram below shows the energy mix between 2000 and 2012. Since 2008 the coal production increased by 3% while the consumption decreased by 7%. Renewable energy generation was inexcusably insignificant – only 0.6% of the coal consumption in 2012. Still in 2012, renewable energy generation (Btu) was inexcusably insignificant amounting only 0.6% of the total coal consumption.
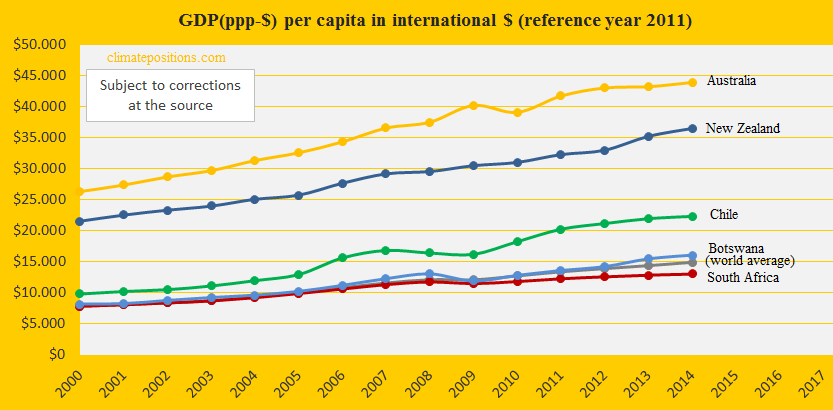
The diagram below shows the development of GDP(ppp-$) since 2000, in comparison with four countries at the same latitude: Australia, New Zealand, Chile, Botswana, and the world average. South Africa is among the most inequal countries in the world (‘Ranked’ 2nd on World Bank Gini Index, 2011) and the income of the 10% richest was 33 times higher than the income of the 10% poorest (‘Ranked‘ 17th on UN R/P, 2011).
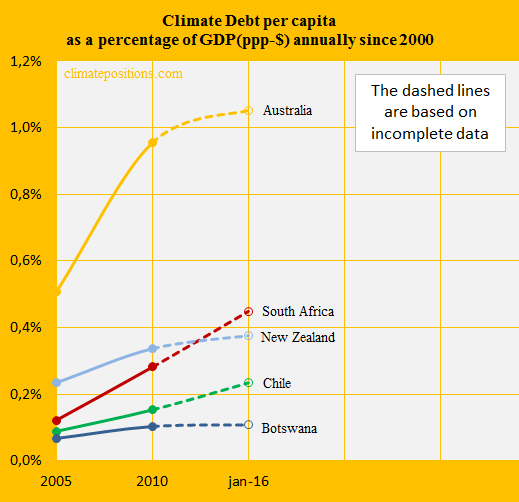
By January 2016 the South African Climate Debt as share of the GDP(ppp-$), annually since 2000, was 0.45% and the ‘Ranking’ was 23rd – in 2010 the ranking was 32nd. The deprived performance since 2005 is shown in the diagram below along with the same four countries.
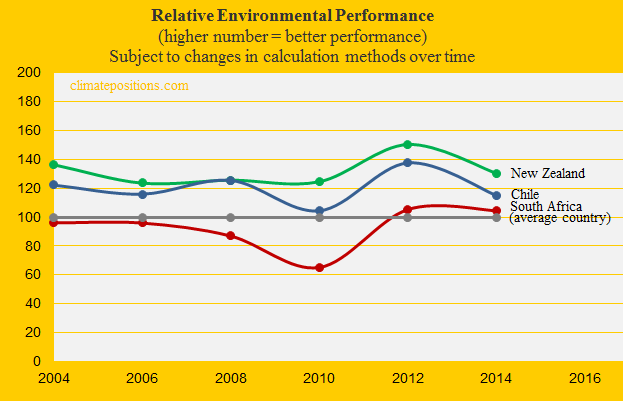
The relative Environmental Performance over time of South Africa, New Zealand and Chile, with the world’s average set at 100, is shown below. The ‘Environmental Performance Index’ published January 2016 (data-year is set at 2014 in the diagram) ranks South Africa 81st among 180 countries. The lowest rankings are on “Water and Sanitation”, “Biodiversity and Habitat” and “Forests”. See more details on the ‘South African performance’. The previous Index published in 2014 ranked South Africa 72nd.
.
Updated data and diagrams of all ‘Indicators’ and all countries in ClimatePositions are available in the menu ‘Calculations (Excel)’.
Data on carbon emissions (CO2 Emissions) from fossil fuels (without bunkers) and cement production are from Global Carbon Project (CDIAC); (links in the menu “Calculations”).
Data on energy production and consumption is from ‘U.S. Energy Information Administration (EIA)’.
Information on national GDP(ppp-$) per capita: Worldbank (links in the menu “Calculations”).
Source on Environmental Performance: Yale and Columbia University reports, published 2006-2016 (links in the menu “Calculations”).
Inequality by country is from: ‘https://en.wikipedia.org/wiki/List_of_countries_by_income_equality’.
Drawing by Claus Andersen, 2016.
Comments are closed.