2014-updates of GDP(ppp-$) … rising along with the temperature

2015
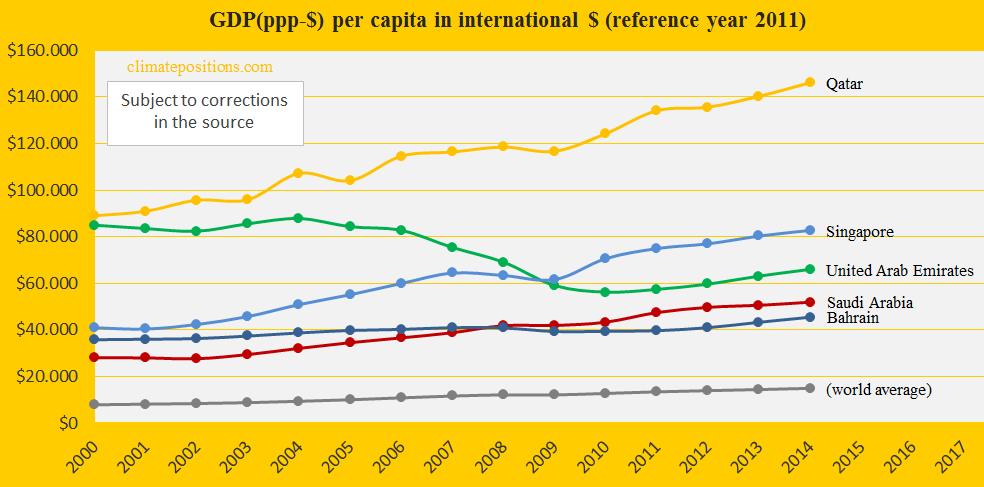
The national Climate Debt in ClimatePositions increases with growing GDP(ppp-$)¹. 2014-updates of GDP from ‘World Bank’ are now available in ‘Calculation (Excel)’. The world’s average per capita GDP(ppp-$) grew from $14,417 in 2013 to $14,939 in 2014. The diagram below shows the development in GDP(ppp-$) in 2000-2014 of the world average and five of the world’s largest per capita fossil fuel CO2 Emitters (in 2012): Qatar (50.8 tons of CO2), United Arab Emirates (44.0 tons), Singapore (38.8 tons), Bahrain (25.8 tons) and Saudi Arabia (22.0 tons).
Not only are the five giant CO2-emitters extremely wealthy compared to the world average, they have disqualified themselves double by having contributed with zero climate finance to developing countries most vulnerable to global warming. The combined Climate Debt of the five countries is about ten times larger than the one of the entire African continent.
Due to the growth in GDP(ppp-$) in 2014, Qatar’s per capita Climate Debt increased from $35,927 to $37,430 (4.2% increase) … Qatar is the worst performing country in ClimatePositions (see the ‘ranking‘ by November 2014).
¹Contributing Free countries in ClimatePositions will remain Contribution Free regardless of the size of the GDP(ppp-$). The idea is that the economic motivation for the green transition must be the same for rich and poor countries. Note that the GDP(ppp-$) in recent years is given more weight than the past (the value is called GDP+).
.
Had Qatar performed the same CO2 Emission reduction rate in 2011-2013 as in 2005-2010 (read this ‘article’), and furthermore kept the lower level of GDP(ppp-$) since 2005, then the total Climate Debt would have been $43 Billion instead of $73 Billion (41% reduction).
…
Information on national GDP(ppp-$) per capita: Worldbank (links in the menu “Calculations”).
Source on CO2 Emissions: EIA, U.S. Energy Information Administration and data on preliminary national CO2 Emissions are from Global Carbon Project (links in the menu “Calculations”).
Drawing by Claus Andersen, 2015.
Comments are closed.