China’s growing climate debt and carbon dioxide emissions is catastrophic
2014
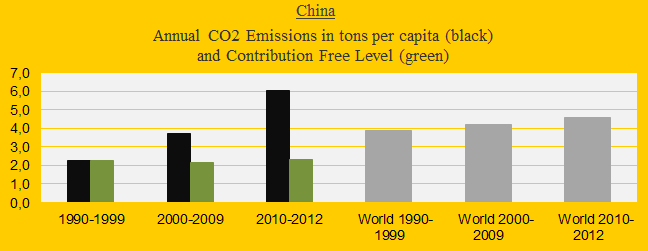
Today, China ‘agreed‘ with the United States (without the Republicans!?) that the Chinese CO2 Emissions can increase by 2030, after which emissions shall decrease. The agreement is legally non-binding and can almost be seen as a confirmation of the ‘worst case climate scenario‘. The first diagram shows the CO2 Emissions of China (the black bars) in decades in comparison with the world average (the grey bars). The green bars show the Chinese Contribution Free Levels in ClimatePositions. Today the Climate Contribution (climate debt) is $402 per capita and the ranking is 52nd out of 147 countries (see the ‘ranking’). The updated Chinese Climate Contribution is 10.3% of the global contribution, second only to the United States (see the ‘ranking’).
The diagram below shows the annual CO2 Emissions per capita since the millennium. The emission in 2013 is a preliminary estimate. The green bars show the Contribution Free Level (read more in the menu ‘About’). The catastrophic development occurs in a country with 20% of the global population and China emitted around 28% of the global CO2 from fossil fuels and cement in 2013. 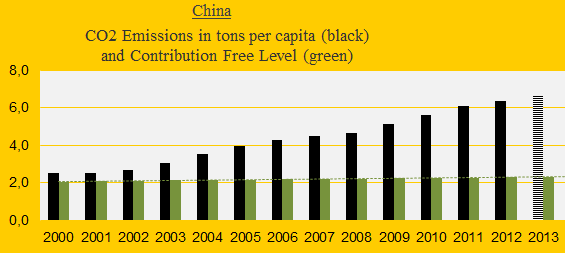 China has surpassed seven countries in climate debt since 2005: Jordan, Turkey, Jamaica, Mexico, Hungary, Thailand and Serbia. The latter three have been distanced after 2010. The diagram below shows the relative Climate Contributions (climate debt) of China, Thailand and Serbia, with the world average set at 100. Now, the Chinese climate debt per person is more than half of the world average.
  Rapid increase of CO2 Emissions and growing GDP(ppp-$) usually go hand in hand and the exploitation of the planet’s atmosphere as a carbon dump happens because it is profitable. The diagram below shows the annual GDP(ppp-$) since 2000 of China, Thailand, Serbia, Albania, El Salvador and Guatemala. The latter three are the only countries in ClimatePositions that have moved from having a (small) climate debt to being Contribution Free.
 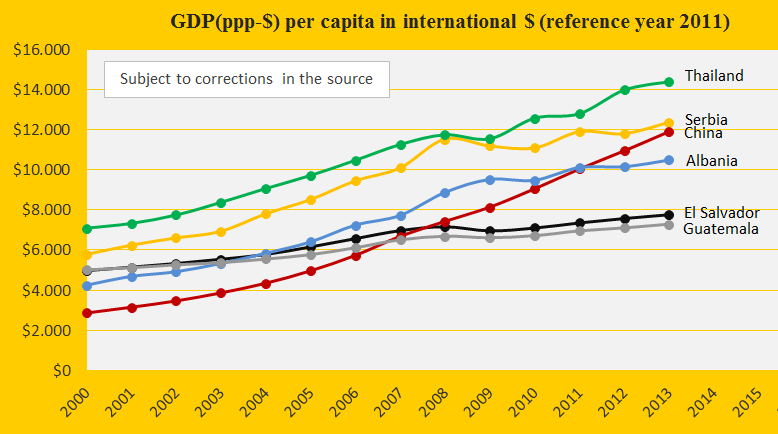 The next diagram (below) is a fusion of the previous two. China, Thailand and Serbia’s Climate Contributions are expressed as an annual percentage of the GDP(ppp $) since 2005. The curve will rise if the Climate Contribution increases faster than the national wealth. China and Serbia followed the same disastrous line to a point, after which Serbia improved remarkably. To become a wealthy nation without polluting the atmosphere requires foresight and leadership. See the ‘ranking‘.
 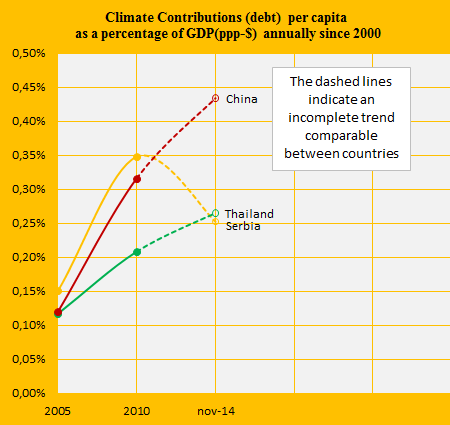 The diagrams below show some population trends of China. The growth rate since 2000 is far below the world average, but there are still many more people per km2 in China.
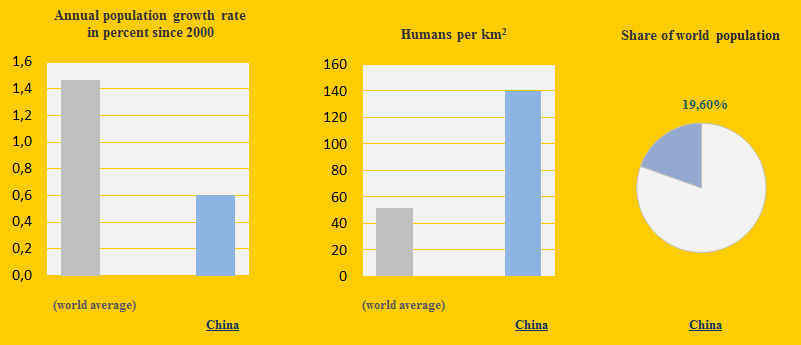
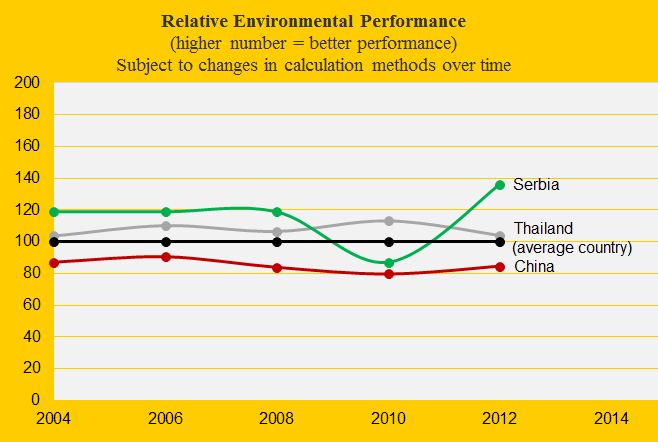
China’s Environmental Performance remains stable well below the average of the countries included in the study. The last diagram compares China with Serbia and Thailand.
.
If China’s Forest Cover had not increased from 17% in 1990 to 22% in 2010, then the Climate Contribution (climate debt) would have been 6% larger.
Information on national GDP(ppp-$) per capita: Worldbank (links in the menu “Calculations”).
Source on CO2 Emissions: EIA, U.S. Energy Information Administration (links in the menu “Calculations”).
Data on national and global Populations: EIA, U.S. Energy Information Administration (links in the menu “Calculations”).
Sources on national forest area: United Nations (UN) (links in the menu “Calculations”).
Source on Environmental Performance: Yale and Columbia University reports, published 2006-2014 (links in the menu “Calculations”).
Comments are closed.