Climate change performance of Saudi Arabia and Canada
2014
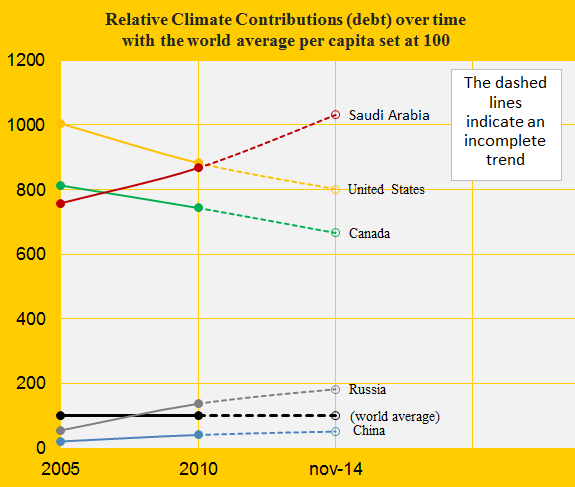
The first diagram shows the relative Climate Contribution (debt) per capita of Saudi Arabia, Canada, China, the United States and Russia, with the world’s average set at 100. Around 2007 Saudi Arabia passed Canada and since then, the gap has grown considerably. Today, the climate debt per capita accumulated since 2000 are respectively $7,936 and $5,128 (see the ‘ranking’).
The Climate Contributions are calculated by using eleven ‘indicators’ of which national CO2 Emissions from the burning of fossil fuels is the principal. Extraction and export of fossil fuels is not one of the indicators which Saudi Arabia should be thankful for – wealth measured as ‘GDP(ppp-$)‘, however, is an indicator.
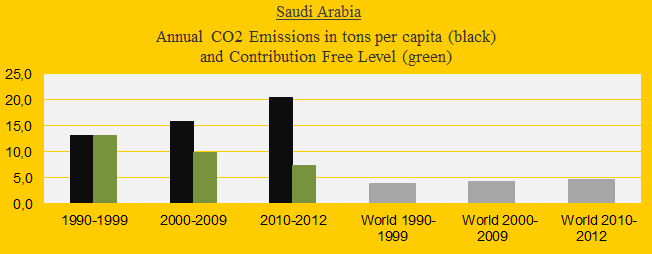
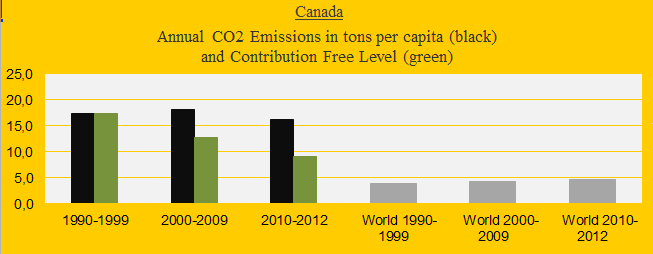
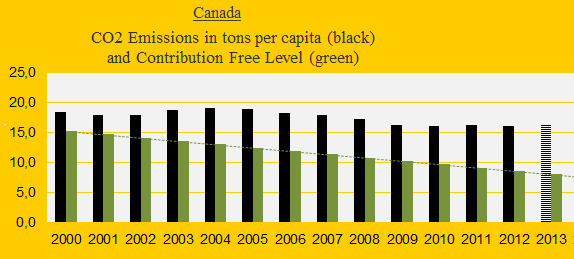
The two diagrams below show Saudi Arabia’s and Canada’s CO2 Emissions per capita in decades. The green bars show the Contribution Free Level and the grey bars are the world average. The authoritarian regime of Saudi Arabia seems ruled by boundless cynicism regarding the climate change disaster. Canada’s per capita emissions were surpassed by Saudi Arabia in 2009.
Here are some perspectival key trends to be taken into account before proceeding:
- Canada has reduced CO2 Emissions from coal by 33% from 2005 to 2012.
- Canada has reduced CO2 Emissions from other fossil fuels than coal by 3% from 2005 to 2012.
- Saudi Arabia has increased the oil production by 22% from 2000 to 2013.
- Saudi Arabia has zero renewable electricity generation.
- The world energy consumption has increased by 31% from 2000-2012.
- The world population has grown by 15% from 2000 to 2012.
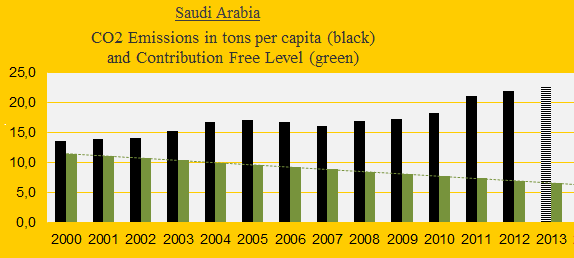
The diagrams below show the CO2 Emissions annually since 2000 of Saudi Arabia and Canada. Their shares of the global CO2 Emissions were respectively 1.83% and 1.73% in 2012. Canada’s phasing out coal explains most of the emission reductions. However, Canada’s coal production is stable over the last decade.
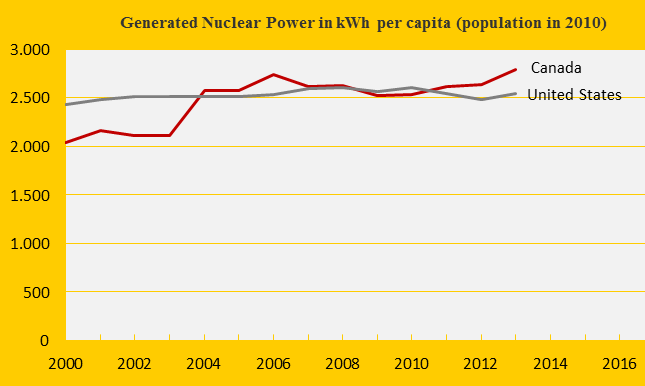
The Canadian Nuclear Power generation has increased by 37% from 2000 to 2013 (and is now around 14% of the total electricity generation). The diagram below shows the per capita generation in comparison with the United States. In ClimatePositions Nuclear Power is regarded as an unacceptable method for reducing CO2 Emissions. Read ‘more‘.
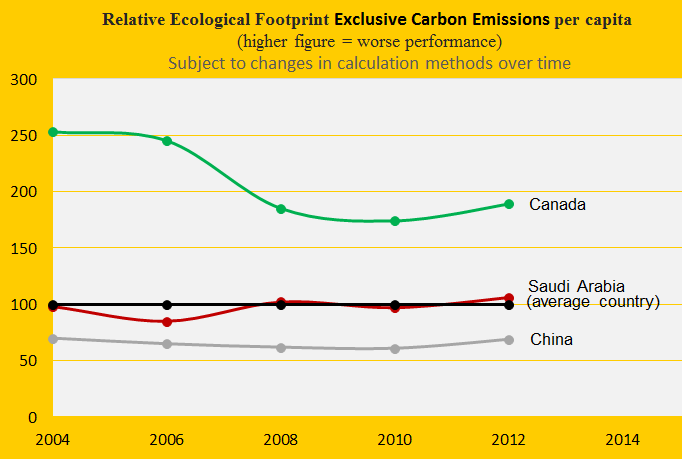
The next diagram (below) shows the relative per capita Ecological Footprint without carbon emissions, with an average country set at 100. Saudi Arabia’s demand on the world’s recourses – excluding carbon emissions – is considerably smaller than Canada’s, but larger than e.g. China’s.
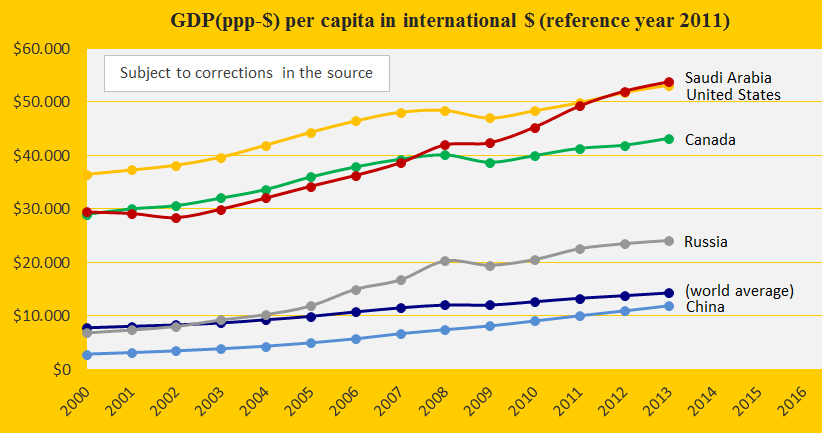
The Saudi Arabian behavior can be summarized as follows: Full steam on oil production, full steam on CO2 Emissions, full steam on the economy and full steam on global warming. The diagram below shows the GDP(ppp-$) of Saudi Arabia, Canada, the United States, China, Russia and the world average. The wealth of Saudi Arabia exceeded the one of Canada during the financial crisis in 2008 and the one of the United States in 2012.
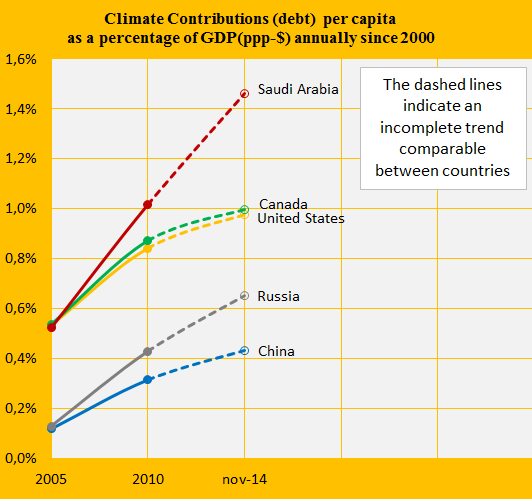
The last diagram illustrates the development of Saudi Arabia, Canada, the United States, China and Russia. The Saudi Arabian Climate Contribution (debt) calculated as a percentage of the GDP(ppp-$) annually since 2000, has increased from 0.52% in 2005 to 1.46% in 2014 (preliminary figure). The Canadian increase rate is more moderate (0.54% and 1.00%).
.
A hypothetical example: If Canada’s CO2 Emission reductions since 2005 had started in 2000 (and continued till today), then the total climate debt would have been $122 billion instead of $176 billion (a saving of $54 billion).
Source on Ecological Footprint: WWF reports “The Living Planet” published 2006-2014 (links in the menu “Calculations”).
Information on national GDP(ppp-$) per capita: Worldbank (links in the menu “Calculations”).
Source on CO2 Emissions: EIA, U.S. Energy Information Administration and data on preliminary national CO2 Emissions are from Global Carbon Project (links in the menu “Calculations”).
Data on national Nuclear Power generation: World Nuclear Association (links in the menu “Calculations”).
Source on energy consumption and production: EIA, U.S. Energy Information Administration (links in the menu “Calculations”). See also detailed information on ‘Saudi Arabia‘ and ‘Canada‘.
Comments are closed.