Climate change performance of Uruguay, Paraguay and Argentina
2015
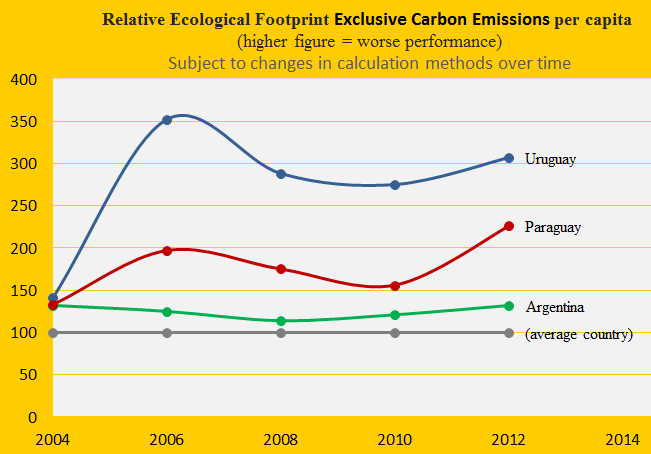
Due to livestock Uruguay has the world’s 2nd largest Ecological Footprint (without carbon emissions) per capita and Paraguay is 5th. Argentina is ranked 37th among 154 countries. The first diagram shows the development since 2004, with the world average set at 100. The footprint is one of several ‘indicators’ in the calculation of Climate Debt in ClimatePositions.
The Climate Debt of Uruguay, accumulated since 2000, is $124 per capita and Paraguay is Contribution Free (no Climate Debt). Due to lack of data of GDP Argentina is excluded from the ranking – however if the GDP(ppp-$) were to be set at the level of Uruguay, then the Argentine Climate Debt would be $405 per capita. The following examines the indicators of CO2 Emissions (carbon dioxide from fossil fuels), Forests, Ecological Footprint and GDP(ppp-$).
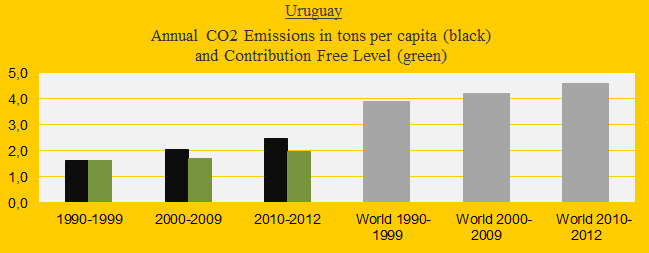
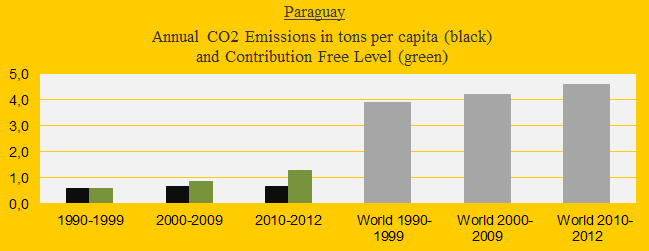
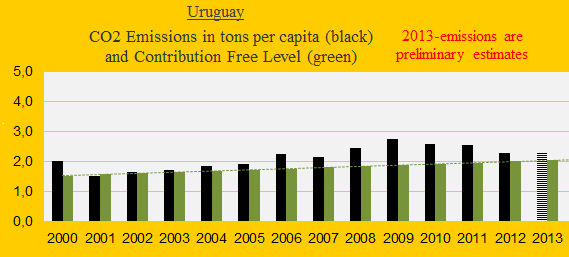
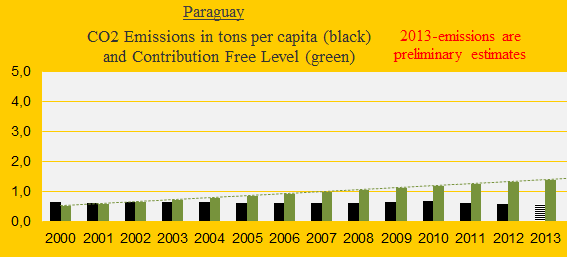
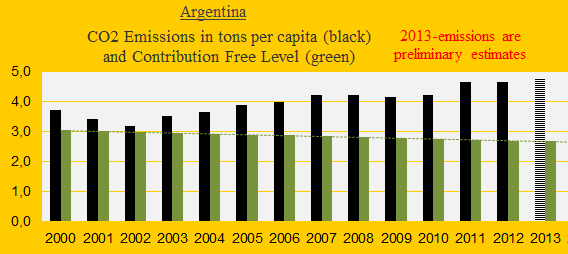
The three diagrams below show the CO2 Emissions per capita in decades of Uruguay, Paraguay and Argentina in comparison with the world average (the grey bars). The green bars show the Contribution Free Level in ClimatePositions – the Free Level is calculated on the basis of the level of CO2 Emissions in 1990s and a number of continuously updated indicators.
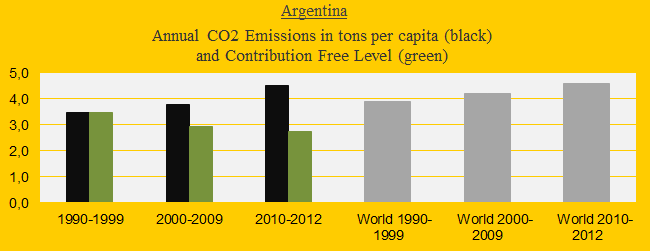
The next three diagrams show the CO2 Emissions per capita from 2000 to 2013 (2013-emissions are preliminary estimates). Today, Argentina’s emissions per capita are at the world average.
The table below shows the Forest Cover in 1990 and 2010 and Primary Forests in 2000 and 2010 (as percentages of the total land area). The Uruguayan increase of Forest Cover since 1990 is rather impressive. The opposite goes for Paraguay and Argentina. Read the hypothetical calculation example at the bottom. Read also details on the large forests of ‘Paraguay‘.
| . | Forest Cover | Forest Cover | Primary Forests | Primary Forests |
| . | 1990 | 2010 | 2000 | 2010 |
| . | . | . | . | . |
| Uruguay | 5.3% | 10.0% | 1.7% | 1.7% |
| Paraguay | 53.3% | 44.3% | 4.6% | 4.6% |
| Argentina | 12.7% | 10.7% | 0.6% | 0.6% |
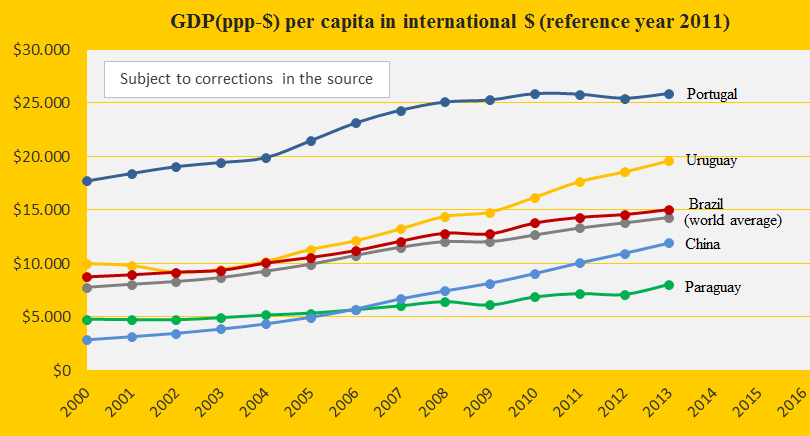
The GDP(ppp-$) per capita since 2000 of Uruguay and Paraguay (no data is available for Argentina), Brazil, Portugal and the world average, is shown in the diagram below.
.
A hypothetical example: If Uruguay had an Ecological Footprint (without carbon) the size of Argentina, then the Climate Debt would be $97 per capita instead of $125.
.
Source on Ecological Footprint: WWF reports “The Living Planet” published 2006-2014 (links in the menu “Calculations”).
Source on CO2 Emissions: EIA, U.S. Energy Information Administration and data on preliminary national CO2 Emissions are from Global Carbon Project (links in the menu “Calculations”).
Sources on national forest cover and primary forests: United Nations (UN) (links in the menu “Calculations”).
Information on national GDP(ppp-$) per capita: Worldbank (links in the menu “Calculations”).
Comments are closed.