Climate change performance: South Korea vs. Indonesia (peatlands in Southeast Asia)
2017
In 2015 South Korea and Indonesia accounted for 3.60% and 0.51% of the global Climate Debt, respectively (see the ‘Ranking‘). The following examines the ‘Indicators‘ of CO2 Emissions, GDP(ppp-$), Forest Cover (and peatlands) and Primary Forest.
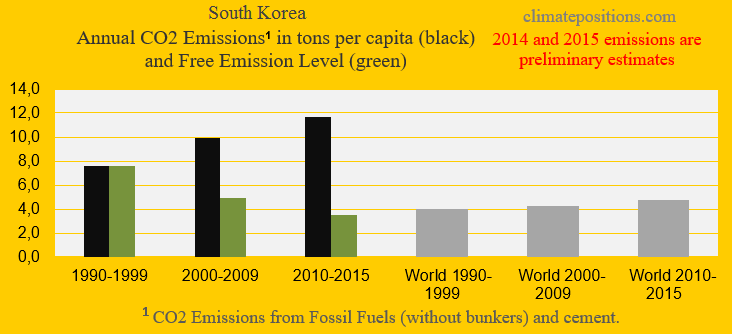
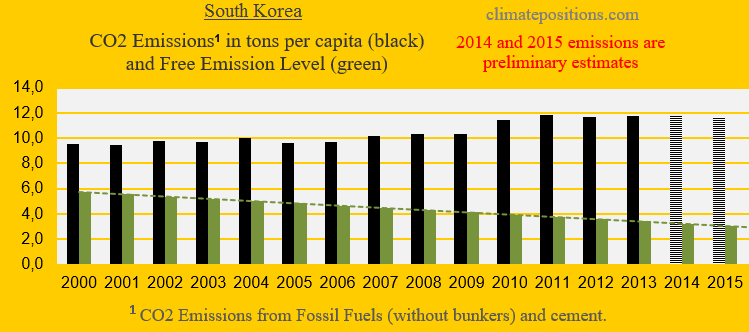
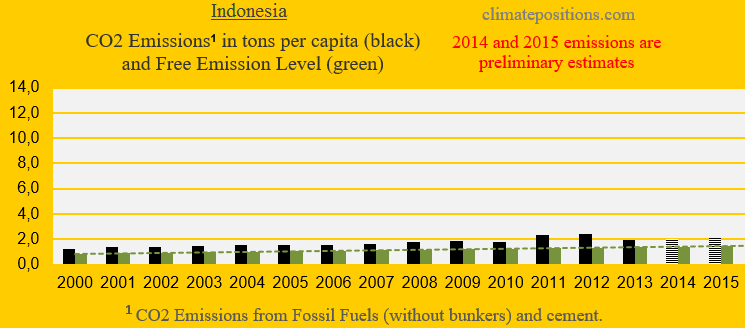
The first two diagrams show the per capita CO2 Emissions from Fossil Fuel (without bunkers) and cement, annually since 2000, of South Korea and Indonesia. The green bars show the Free Emission Level¹ – the exceedance is the basis for calculating the national Climate Debt. The world’s 9th and 10th largest CO2-emitters were responsible for 1.7% (South Korea) and 1.5% (Indonesia) of global emissions in 2015, respectively. South Korea’s per capita emissions were 11.7 tons in 2015 (preliminary), while Indonesia’s were 2.1 tons (preliminary), which was 2.2% above the 2014-level.
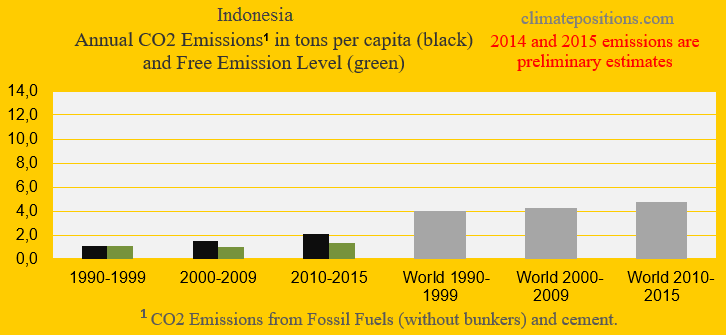
The next two diagrams show South Korea’s and Indonesia’s CO2 Emissions in tons per capita, in decades. The grey bars are world emissions average. The green bars show the Free Emission Level¹ compared to the emission level in the 1990s. South Korea must decrease emissions by around 69%, by 2020 (compared to the 1990s), while Indonesia can increase emissions by around 46%. Indonesia’s 2015-emissions (2.1 tons, preliminary) decreased by 14% compared with 2012 (2.4 tons).
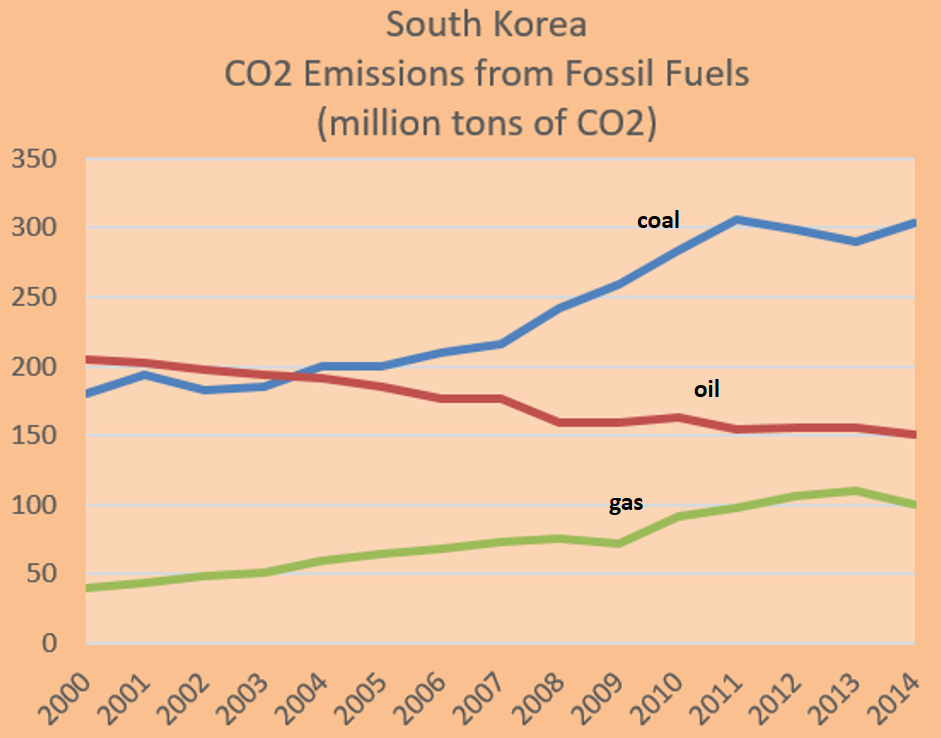
South Korea’s CO2 Emissions from from burning of coal, oil and natural gas, since 2000, is shown below. Of the three, coal is by far the worst climate destroyer and South Korea was the world’s 9th largest coal consumer in 2014. To make the stupidity even more obvious, Reuters ‘Wrote‘ in March 2016: “An increase in the number of coal-fired power plants starting operations this year will likely drive record coal demand in South Korea, despite the country’s pledge to curb greenhouse gas emissions at last year’s Paris climate summit. The Korea Energy Economics Institute (KEEI), a government-run think tank, forecasts South Korean coal demand will rise 6.3 percent to more than 140 million tonnes in 2016, as 9 new plants with a combined capacity of 7.7 gigawatts come online.”
By the way, coal started off as peat hundreds of million years ago (see an illustration ‘Here‘.)
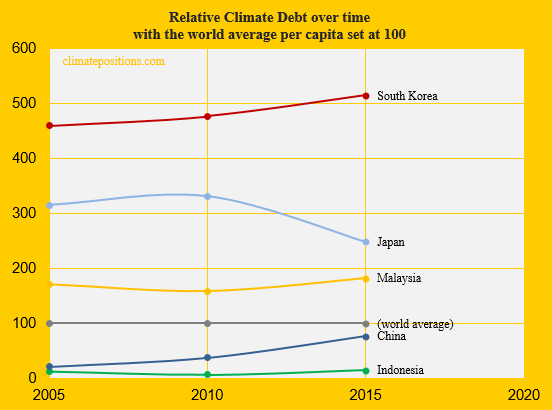
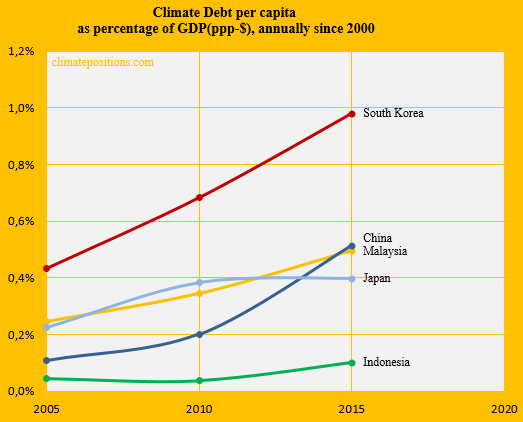
The diagram below shows the relative per capita Climate Debt of South Korea and Indonesia, in comparison with China, Japan and Malaysia – with the world’s average Climate Debt set at 100. South Korea’s current per capita Climate Debt is $4,261 while Indonesia’s is $118 (see the latest ‘Ranking‘).
[Some figures in this article were corrected 22/5 2017]
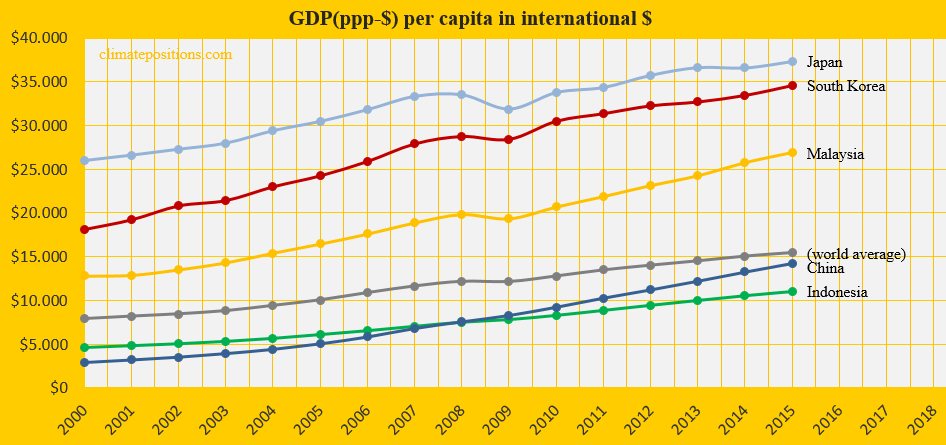
The diagram below shows the per capita GDP(ppp-$) of the same five countries and the world average. The current wealth of South Korea is more than three times the one of Indonesia.
The next diagram (below) shows Climate Debt of the five countries calculated as percentage of GDP(ppp-$), annually since 2000. See the updated ‘Ranking‘.
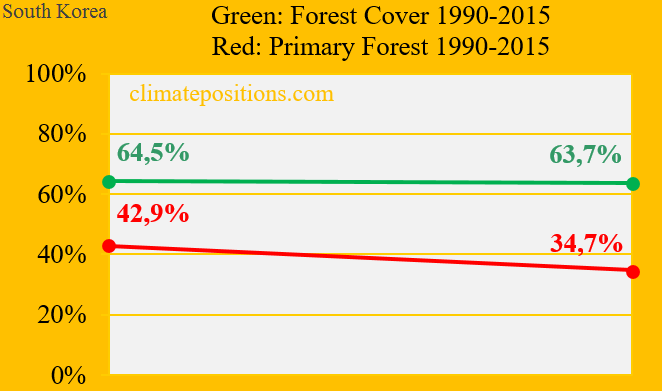
South Korea’s area-change since 1990 in Forrest Cover and Primary Forests are shown in the diagram below. The South Korean loss of the precious Primary Forests since 1990 is more than one-fifth. The total loss of Forest Cover and Primary Forests since 1990, accounts for around 10% of the current South Korean Climate Debt.
Back in the 1960s, about 80% of Indonesia was covered with forest, compared to 69% in 1990 and 53% in 2015. Since 1990 the loss of Forest Cover and Primary Forests accounts for 46% of the current Indonesian Climate Debt. Diagrams and detailed background information are available in the article: ‘Indonesia’s Climate Debt, rainforests, waters and greenhouse gas emissions‘.
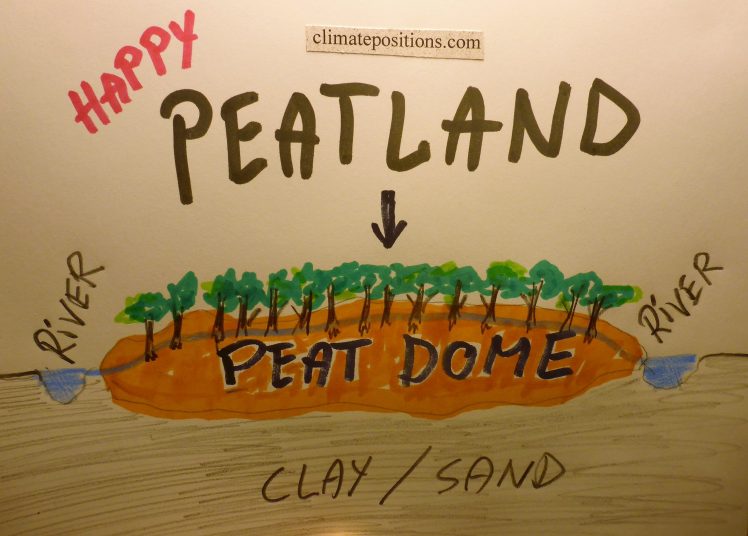
Indonesia holds the world’s largest tropical ‘Peat‘ carbon stocks (and the peatland areas hold around 30% of Indonesia’s forests). However, the islands of Borneo, Sumatra and New Guinea have suffered damage or loss to about 94,000 km² of the peatland over recent decades, primarily due to drainage for agricultural use and forest fires. For comparison Indonesia’s Primary Forests amounts to about 460,000 km² (source a).
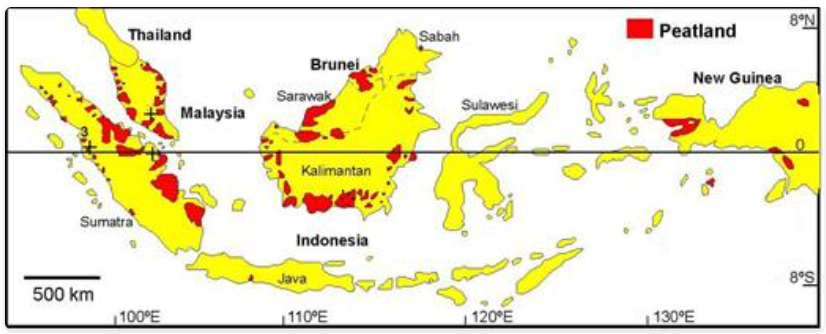
The amount of carbon in tropical peat represent between 5% and 6% of the global soil carbon pool on Earth and lowland peatlands in Southeast Asia have very high carbon density² and the total regional peat carbon store amounts to around 68.5 Gt (source b), which (if released to the atmosphere) is equivalent to the world’s total CO2 Emissions from Fossil Fuel (without bunkers) and cement in about seven years. Emissions from peat decomposition more than 5 years after drainage from tropical peatlands in Southeast Asia, were found to emit carbon equivalent to between 1.3% and 3.1% of the global CO2 Emissions from Fossil Fuel in 2006 (source c). See the peatland locations in Indonesia, Thailand, Malaysia and Brunei in the map below (source b). Recent discoveries in Africa places the Democratic Republic of Congo and the Republic of Congo as the 2nd and 3rd most important countries in the world for tropical peat carbon stocks (read this ‘Article‘ from the Guardian).
It has been estimated that Indonesia’s peatland carbon-outflow to the atmosphere in the year 2003 made the country the 3rd largest greenhouse gas emitting nation, close to the leading United States and China, and that peat fires in Indonesia in 1997-1998 emitted an amount of CO2 into the atmosphere comparable with 15-40% of the global Fossil Fuel emissions during the same period (source b).
National area changes since 1990 of Forest Cover and Primary Forests are ‘Indicators‘ in ClimatePositions, however, changes in peatlands are not (luckily for Indonesia). If Indonesia paid its relatively small Climate Debt, along with all the other debtors, then it would be an obvious beneficiary from a potent (non-existent) global climate fund, for projects that could stop the decline of peatlands.
Added 15-02-2017: Finally, the table below shows four key values of the five countries, in the calculation of national Climate Debts in ClimatePositions. The price of CO2 per ton (column two) is for the total CO2 Emission from Fossil Fuels (without bunkers) and cement. Climate change financing (column three) is from June 2016.
| . | Tons of CO2 | Price per | Climate change | Financing as |
| . | exceeded since | ton CO2 | financing | share of |
| . | 2000, per capita | since 2000 | per capita | Climate Debt |
| . | . | . | . | . |
| South Korea | 98.77 | $25.23 | $0.26 | 0.05% |
| Indonesia | 9.48 | $4.24 | $0.00 | 0.01% |
| China | 47.35 | $7.86 | $0.01 | 0.00% |
| Japan | 44.39 | $14.30 | $15.73 | 1.14% |
| Malaysia | 50.03 | $13.97 | $0.00 | 0.00% |
¹The Free Emission Level (green bars) is determined by national CO2 Emissions 1990-1999 (baseline), and 11 more ‘Indicators‘, of which 7 are national and 4 are global.
²According to IPCC, carbon emission factors for drained peatland forest in tropical areas are about ten times higher than those for boreal areas and two times higher than those for temperate areas (source b).
.
Updated data and diagrams of all ‘Indicators‘ and all countries in ClimatePositions are available in the menu ‘Calculations (Excel)’.
Data on carbon emissions (CO2 Emissions) from fossil fuels (without bunkers) and cement production are from Global Carbon Project (CDIAC); (links in the menu “Calculations”).
Information on national GDP(ppp-$) per capita: Worldbank (links in the menu “Calculations”).
Sources on national Forest Cover and Primary Forests: United Nations (UN) (Report: Global Forest Resources Assessments) (links in the menu “Calculations”).
Sources on national Marine Protection: United Nations (UN) (links in the menu “Calculations”).
Sources on tropical peatlands:
a) The Guardian: ‘World’s largest tropical peatland found in Congo basin’ (2017).
b) Tropical peat research in Department of Forest Sciences, University of Helsinki: ‘http://blogs.helsinki.fi/jyjauhia/‘.
c) FAO 2014: ‘Towards climate-responsible peatlands management‘ (pdf 117 pages).
d) The Guardian: ‘WWF and Greenpeace break with Indonesia’s pulp and paper giant‘ (2016).
Drawing by Claus Andersen, 2017 (inspired by: ‘http://blogs.helsinki.fi/jyjauhia/files/2014/09/Picture2.png‘).
Comments are closed.