Environmental Performance Index 2016: Ranking of 180 countries
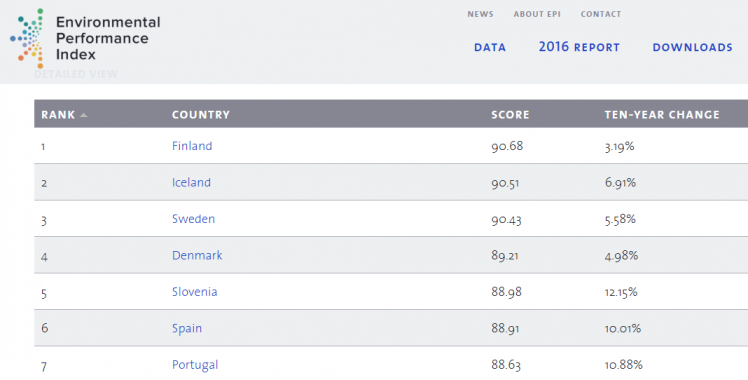
Every second year Yale and Colombia Universities, in collaboration with the World Economic Forum, publish an Environmental Performance Index (EPI) with global ranking. The 2016 edition with ‘Ranking of 180 countries‘ is now available – click on individual countries at the sourse to see more details on Biodiversity and Habitat, Forests, Climate and Energy, Fisheries, Agriculture, Water Resources, Water and Sanitation, Health Impacts and Air Quality. Scores are converted to a scale of 0 to 100, with 0 being the worst observed value and 100 the best. The seven best performing countries are ranked in the table (copied from the site).
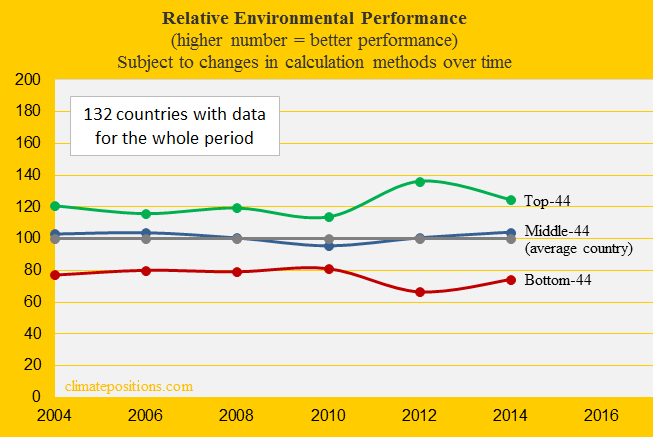
The average national scores in the Environmental Performance Index between the first release year 2006 and 2016 are set at 100 in ClimatePositions (the data year is set at two years prior to the release year). Diagrams of national developments over time, illustrates the performance, relatively, with an average country set at 100. Or in other words: A decreasing graph since the last report is not necessarily due to an actual worsening of the performance.
The diagram below includes only the 132 countries with data from the entire period, divided into three groups: 1) The 44 best performing countries in the data year 2014 (release year 2016), 2) The 44 middle performing countries and 3) The 44 worst performing countries. The general trend seems clear: In the data year 2012 the span between top and bottom increased significantly, and the opposite occurred in 2014. Note that differences in measurement methods over time are not taken into account.
Top rankings in the Environmental Performance Index are far from a guarantee of sustainability; read this ‘article’. Read also about some of the overall ‘key findings‘ in the report.
The relative Environmental Performances over time (release year 2006-2016) of 180 countries, with diagrams, is available in the menu “Calculation (Excel)”.
.
The average relative Environmental Performance since 2006 (data year 2004) is used in the calculation of Climate Debt in ClimatePositions. The Bolivian per capita Climate dropped from $25 to $24 (4% reduction) due to the 2016-update of the Environmental Performance.
.
Source on Environmental Performance Index: Yale and Columbia University reports, published 2006-2016 (links in the menu “Calculations”).
Comments are closed.