Full Democracies means large Climate Contributions (climate debt)
2013
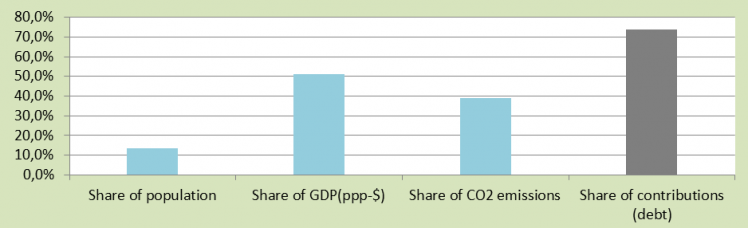
The diagram shows 23 Full Democracy countries’ total share of the global: 1) Population (13%), 2) GDP(ppp-$) (51%), 3) CO2 Emissions (39%) and 4) Contributions (debt) (74%). Only 1/8 of the people on the planet live in other words in Full Democracies and they are accountable for 3/4 of the global Contributions (climate debt) in ClimatePositions 2010. Also the ecological footprint (excluding CO2 Emissions) of a majority of these 23 countries is very large, with an average of 2.7 EPI. Obviously democracies in general are still flawed when it comes to planet responsibility and climate change response. Costa Rica is the only Contribution Free country on the Full Democracy list (more about Costa Rica soon).
Note that the Full Democracy countries have responded wisely to other national challenges: Life Expectancy is between 74 and 82 years (relatively high or very high) and the Environmental Performance is between 67 and 86 EPI (relatively good or very good).
The average inequality-adjusted income (index) among 21 Full Democracy countries (no data on Japan and New Zealand) is 0.68 points (Norway peaks with 0.79 points). The remaining 100 countries on the list have an average as low as 0.40 points (Congo is the bottom with 0.09 points).
Below are the 23 Full Democracy countries ranked in Climate Contributions (debt) in US$ per capita (worst performing country first) in 2010, with the national share of the global Climate Contribution (145 countries) in percent:
- Australia 3.33%
- United States 42.45%
- Canada 4.08%
- Netherlands 1.83%
- Belgium 0.96%
- Ireland 0.35%
- Norway 0.34%
- South Korea 3.27%
- Finland 0.33%
- Austria 0.45%
- Japan 6.39%
- New Zealand 0.19%
- Spain 1.89%
- Germany 3.09%
- France 2.01%
- United Kingdom 1.92%
- Czech Republic 0.24%
- Sweden 0.21%
- Switzerland 0.17%
- Denmark 0.12%
- Mauritius 0.01%
- Uruguay 0.00%
- Costa Rica (Contribution Free)
A hypothetical example: If India (characterized as “flawed democracy” in the Democratic Index) replaced United States on the list of Full Democracies the picture would change completely. The share in the diagram would then appear like this: 1) Population (26%), 2) GDP(ppp-$) (34%), 3) CO2 emissions (25%) and 4) Climate Contributions (debt) (31%). This Picture is close to the global average.
Source on CO2 emissions: EIA, U.S. Energy Information Administration (links in the menu “Calculations”).
Information on national GDP(ppp-$) per capita is from Worldbank (links in the menu “Calculations”). Read about GDP+ in the submenu ”Indicators”.
Data on national and global populations are from the EIA, U.S. Energy Information Administration (links in the menu “Calculations”).
Data sources on environmental performance is from Yale and Columbia University reports, published 2006-2012 (links in the menu “Calculations”).
Data sources on ecological footprint: WWF reports “The Living Planet” published 2006-2012 (links in the menu “Calculations”).
Democratic Index is from Wikipedia (links in the menu “Calculations”).
Data on Inequality-adjusted income is from UN’s International Human Development Indicators (links in the menu “Calculations”).
Data on Life expectancy at birth is from Central Intelligence Agency (The World Factbook) (links in the menu “Calculations”).
Comments are closed.