Global Indicator Update: Land Temperature 2016 (warmest year on record)
2017
The year 2016 was by far the hottest on planet Earth since measurements began in 1880. Both global Land (air) Temperature and Ocean (air) Temperature were the hottest on record. See the development in Land Temperature between 1960 and 2016 in the diagram below. The average temperature rise 1880-1937 is set at 0°C (baseline 1880-1937) and 2016 was 1.73°C warmer. The development since 1880 in Land Temperature and Ocean Temperature (and the two combined) are available at ‘ncdc.noaa.gov‘.
Added 22-01-17: The Ocean Temperature 2016 was 0.94°C warmer compared to baseline 1880-1937, and Land and Ocean Temperature combined was 1.15°C warmer. Note that other sources may refer to baseline 1881-1910 or even 1951-1980.
Added 07-02-2017: Soon, the global temperature ‘Indicator’ in ClimatePosition will be changed from Land (air) Temperature (10-years average) to Land/Ocean (air) Temperature (10-years average). The change will not affect the current accumulated Climate Debt of any country, only the future calculation.
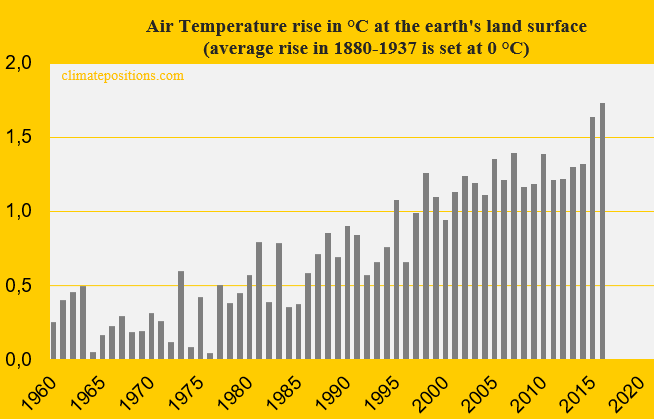
In comparison with the average temperature 1880-1937 the decade 2007-2016 was 1.36°C warmer on average and value is used in ClimatePositions as an ‘Indicator‘.
The diagram below shows a polynomial projection¹ by 2130 of the global Land Temperature. The red projection line start at 0°C in 1880 and the passing-years of 1°C, 2°C, 3°C etc. are marked.
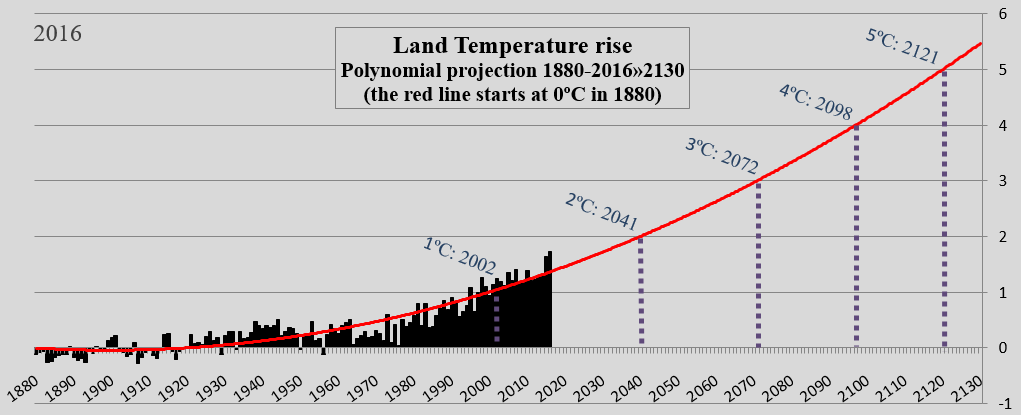
The main drive of the global warming is carbon dioxide emissions from the burning of fossil fuels and other human caused greenhouse gas emissions and activities² add to the warming. However, the dangerous feedback effects³ now seem to accelerate the greenhouse effect as predicted decades ago.
See ten-year Polynomial projections of global Land Temperature from 1980-2010, by 2130, ‘Here‘ (pdf). The polynomial projection lines pass 2°C warming as follows:
- 1880-1980: 2117
- 1880-1990: 2078
- 1880-2000: 2059
- 1880-2010: 2046
- 1880-2016: 2041
.
¹A polynomial projection reproduces data into the future in a sounder manner than a linear projection (is neither a prediction nor a scientific scenario with certain assumptions).
²Human activities such as cement production, deforestation, livestock, agriculture, enteric fermentation, landfills etc.
³Feedback effects (loops) of melting and darkening ice caps (reflecting less sun heat), melting permafrost releasing methane, more water vapor from warmer oceans, weakened rainforests, coral reefs and other ecosystems (absorbing less carbon dioxide), increasing methane leaks from warmed up wetlands, landfills etc. Read this ‘Article‘.
.
A hypothetical example: If the average global Land Temperature during the past decade (2007-2016) had been the same as the decade before (1997-2006), then the accumulated Climate Debt of the United States would have been around 16% lower.
.
Data sources on global temperature: NOAA National Climatic Data Center (links in the menu “Calculations”).
Background articles: ‘Early history of global warming science and predictions’ and ‘Global warming and IPCC worst case scenarios 1990 and 2014’.
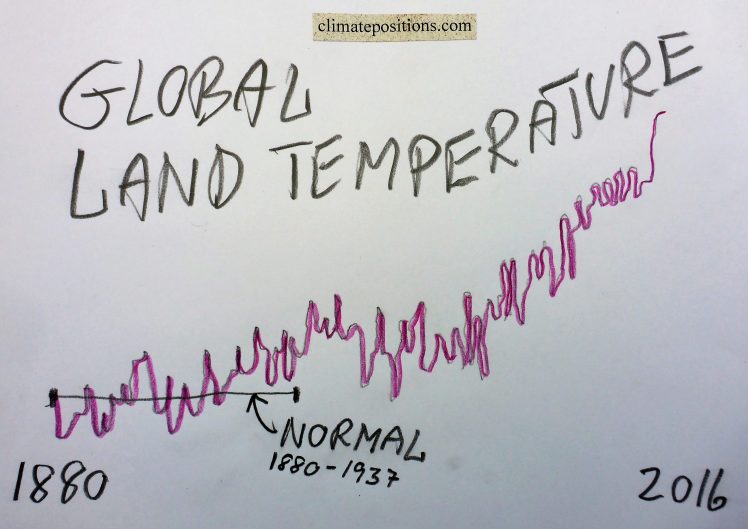
Drawing by Claus Andersen, 2017.
Comments are closed.