The United States’ huge share of the growing global Climate Debt is decreasing

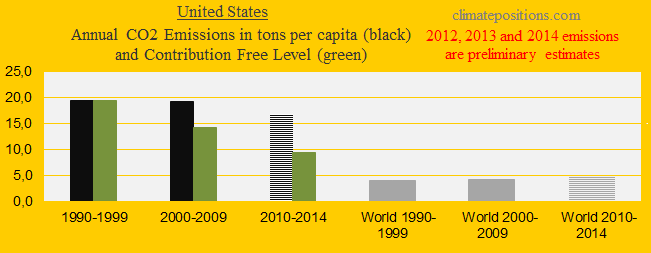
Worldwide, eyes are on the United States due to its massive historic greenhouse gas emissions and its sabotage of attempts to reach a fair and globally binding reduction agreement. Instead, the world is stocked with “intended nationally determined contributions towards achieving the objective […] consistent with holding the increase in the global average temperature to well below 2°C above preindustrial levels and pursuing efforts to limit the temperature increase to 1.5°C.” If this baloney-goal is to be taken seriously, then the United States must cut emissions from fossil fuels by around 80% (give and take), within fifteen years, or so. The following examines the development of CO2 Emissions, Environmental Performance, GDP(ppp-$) and accumulated Climate Debt.The first diagram (below) shows the per capita CO2 Emissions from fossil fuels (without bunker fuels) and cement production in decades in comparison with the world average. CO2 Emissions since 2012 are preliminary estimates. The green bars are the Contribution Free Level, determined by the level of CO2 Emissions in the 1990s and a number of continuously updated ‘indicators’.
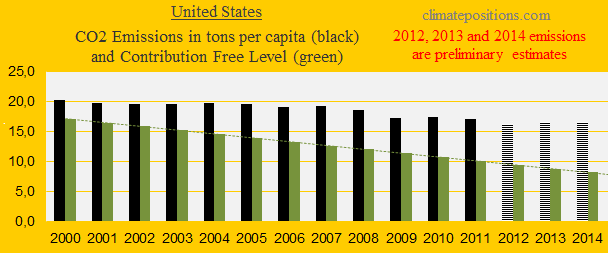
The diagram below shows the per capita CO2 Emissions from fossil fuels (without bunker fuels) and cement production since 2000. CO2 Emissions in 2012, 2013 and 2014 are preliminary estimates. The moderate reductions in recent years are in contrast to the shameful Bush-era after the millennium (the calculation of Climate Debt in ClimatePositions starts in 2000). Mean voices whisper that the lowest hanging-fruits may have been picked now!
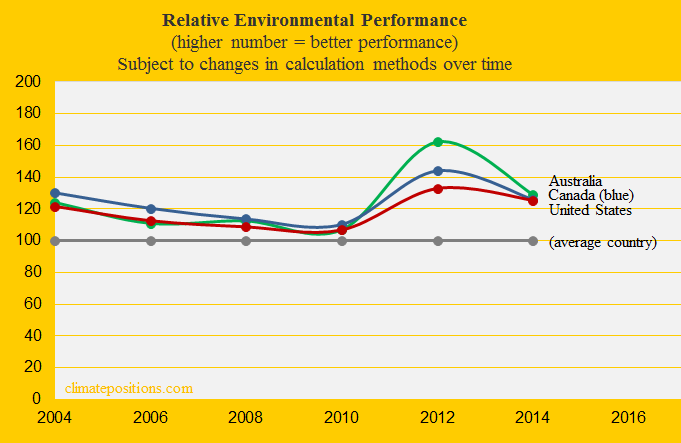
The relative Environmental Performance over time of the United States, Canada and Australia, with the world’s average set at 100, is shown below. The up-to-date ‘Environmental Performance Index’ published January 2016 (data-year is set at 2014 in the diagram) ranks the United States 26th among 180 countries. See details on the US performance ‘her’. The previous ‘Index published in 2014’ ranked US 33rd. The improved ranking doesn’t show on the graph below because many poorer performing countries has improved even more and thereby raised the world average. Note that Environmental Performance Index and Ecological Footprint Network provide completely different rankings and trends due to a different focus (read this ‘article’).
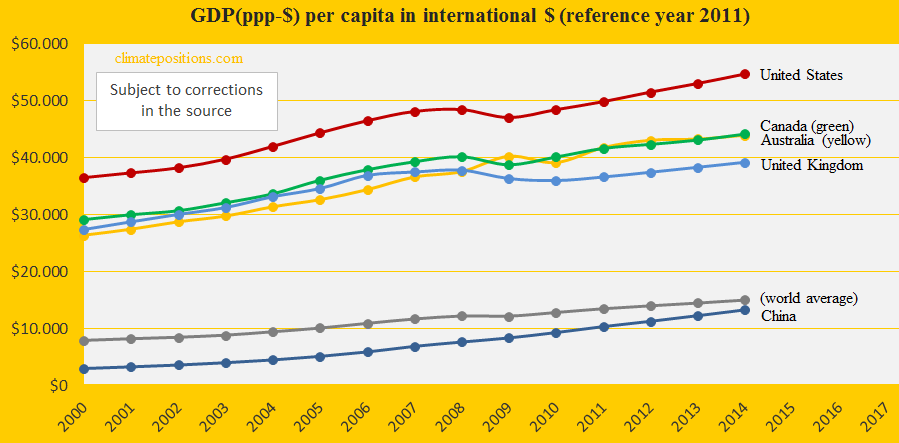
In 2014 the United States was the 7th wealthiest country among 148 with full data in ClimatePositions. The diagram below shows the development since 2000, in comparison with Canada, Australia, United Kingdom, China and the world average.
January 2016 the Climate Debt per capita of the United States was $6,594 and the ‘ranking’ was 7th. The Climate Debts share of the GDP(ppp-$), annually since 2000, was 0.96%. The development since 2005 is shown in the diagram below, along with the same group of countries. United Kingdom stands out positively among the five.

The last diagram shows the per capita Climate Debt since 2005, with the world average set at 100. Among these five countries only the United States has continuously decreased its global share (US is still performing worse than the others, though). In real money the accumulated total US Climate Debt increased from $1,177 billion in 2010 to $2,103 billion by January 2016 (see the ‘ranking’). [2010-values has been corrected in the table February 15th]
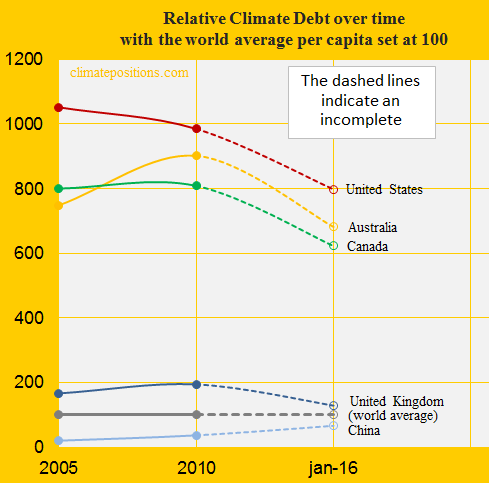
In 2010 the United States’ share of the global Climate Debt was 45.4% and by January 2016 it had decreased to 37.0% (see the ‘ranking’). For comparison, the Chinese share increased from 7.4% to 13.3%. Combined the two superpowers are still responsibly for more than half of the global Climate Debt in ClimatePositions. The ‘calculation-method’ is identical for all included countries.
.
The total accumulated Climate Debt of the United States is $2,086 billion. Without the Environmental Performance improvements, relatively, by 2014 and 2016 (the publishing years), then the Climate Debt would have been $2,148 billion, or $62 billion larger than the current.
.
Data on carbon emissions (CO2 Emissions) from fossil fuels (without bunkers) and cement production are from Global Carbon Project (CDIAC); (links in the menu “Calculations”).
Source on Environmental Performance: Yale and Columbia University reports, published 2006-2016 (links in the menu “Calculations”).
Information on national GDP(ppp-$) per capita: Worldbank.
Drawing by Claus Andersen, 2016.
Background information: ‘From Good Intentions to Deep Decarbonization‘ (Earth Institute/Colombia University, 2015) and ‘US carbon emissions set to fall to lowest level in two decades‘ (The Guardian, 2015).
Comments are closed.