Update 2015: CO2 Content in the atmosphere has passed 400 ppm
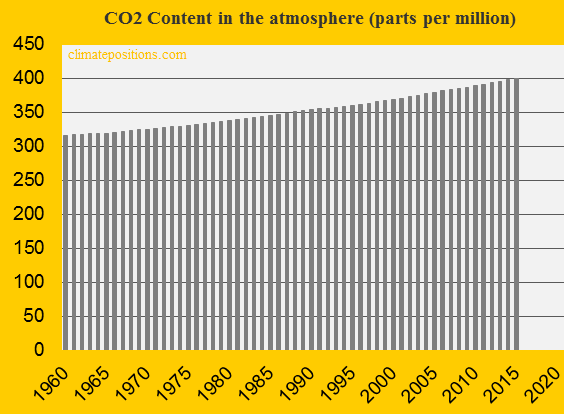
The carbon dioxide content in the atmosphere passed 400 ppm (parts per million) in 2015 (mean). In 2014 the content was 398.61 ppm and in 2015 it was 400.83 ppm – the annually updated figure is used in ClimatePositions.
See the alarming development 1960-2015 in the diagram below. The pre-industrial level was below 300 ppm and 350 ppm is considered the relatively safe limit. Human-caused CO2 Emissions is the main cause of global warming, melting ice sheets, sea level rise and escalation of extreme weather events.
The dramatically accelerating increase of CO2 in the atmosphere since pre-industrial times is illustrated with a few figures below.
- 2015: 401 ppm (+2.1 ppm annually 2000-2015).
- 2000: 370 ppm (+1.3 ppm annually 1960-2000).
- 1960: 317 ppm (+0.2 ppm annually 1850-1960).
- Past 400,000 years till 1850: 180-300 ppm (with Ice Age cycle-variations).
Read also the articles ‘Carbon cycle for beginners‘, and ‘Greenhouse gas emissions and COP negotiation strategies’.
.
National Climate Debts in ClimatePositions increase due to the increase of CO2 in the atmosphere. An example: 3.8% of the accumulated Climate Debt of China is due to increased CO2 contend in the atmosphere between 2000 and 2015 (the 3.8% amounts to $24 billion or $0.19 per tons CO2 emitted from fossil fuels since 2000).
.
Sources on CO2 in the atmosphere: NOAA Earth System Researth Laboratory (links in the menu “Calculations”).
Data on historic carbon dioxide in the atmosphere is from’Wikipedia‘.
Drawing by Claus Andersen, 2016.
Comments are closed.