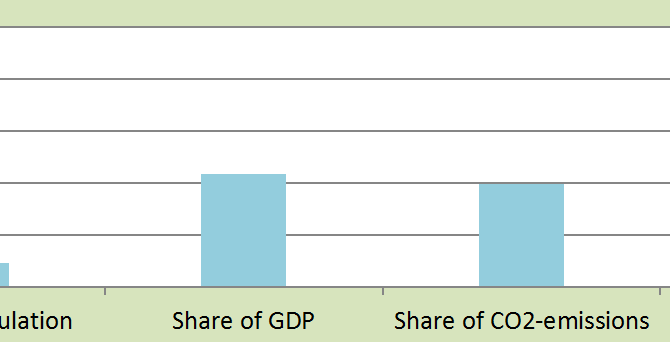
United States’ giant share of the global Climate Contributions (climate debt)
2013
United States was the 7th worst performing country out of 145 in ClimatePositions 2010 (see the menu Contributions/ Per Capita US$ Rank). What make United States the major climate problem on a global scale however, is the country’s size, wealth and failed performance.
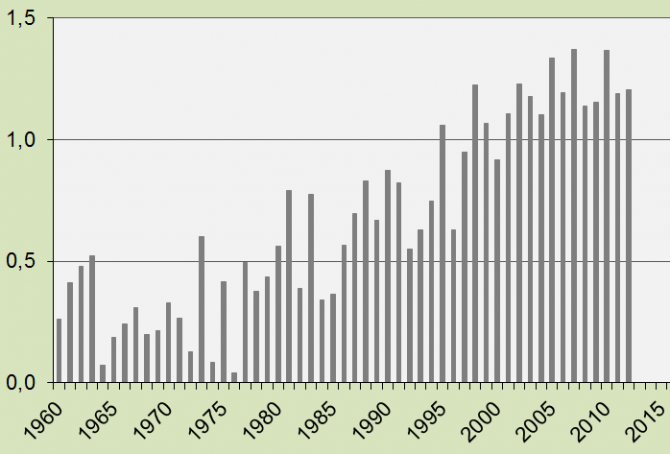
Global Air Temperature since 1960
2013
If the increase in average global land Air Temperature in 1880-1939 is set to 0ºC, the increase in temperature in 1960-2012 is shown in the diagram. The average increase in temperature in the last decade was 1.22 ºC – this figure is included in the latest version of ClimatePositions calculations (Excel).
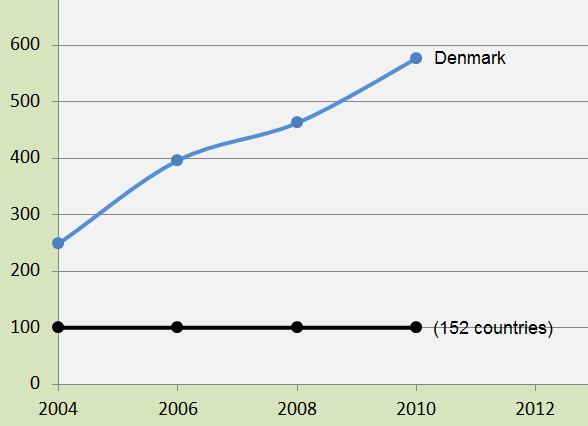
Denmark’s embarrassingly large Ecological Footprint
2013
Denmark did well according to ClimatePositions until 2002, where the Climate Contribution (climate debt) was $0, but under the liberal-conservative government 2001-2011 the performance deteriorated. Denmark was the 55th worst performing country out of 145 in 2005 and the 33rd in 2010.

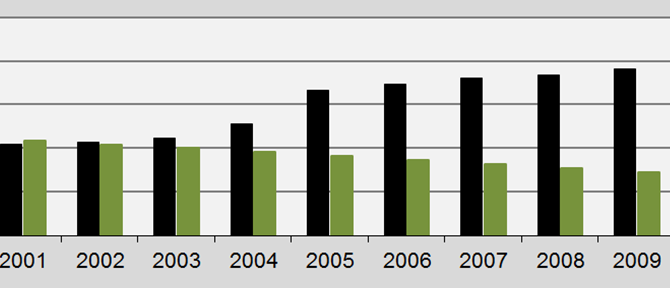
United Arab Emirates goes sky high in CO2 Emissions
2013
In 2000 United Arab Emirates (UAE) was one of 76 Contribution Free countries in ClimatePositions, due to a slight reduction in CO2 Emissions (carbon dioxide). In 2005 however, the country was the 17th worst performer and in 2010 the 4th. The diagram shows UAE’s annual CO2 Emissions in tons per capita in the decades 1990-1999 and 2000-2009, and in 2010-2011 (the black bars). For comparison, the gray bars show the average global CO2 Emissions per capita.
Qatar reducing CO2 Emissions in 2011 from disastrous levels
2013
Note that Qatars’ CO2 Emissions 1990-2010 have been radically adjusted in the data source since this post was published.
Qatar was the no. 1 worst performing country out of 145 in ClimatePositions 2010 with a Climate Contribution of $29,102 per capita. But in 2011 the wealthy oil state reduced CO2 Emissions (carbon dioxide) considerably, to 34.9 tons per capita, from the extreme 76.9 tons per capita in 2010. See the annual CO2 Emissions 2000-2011 in the diagram below (the black bars). The green bars show the Contribution Free Level of CO2 Emissions in ClimatePositions.