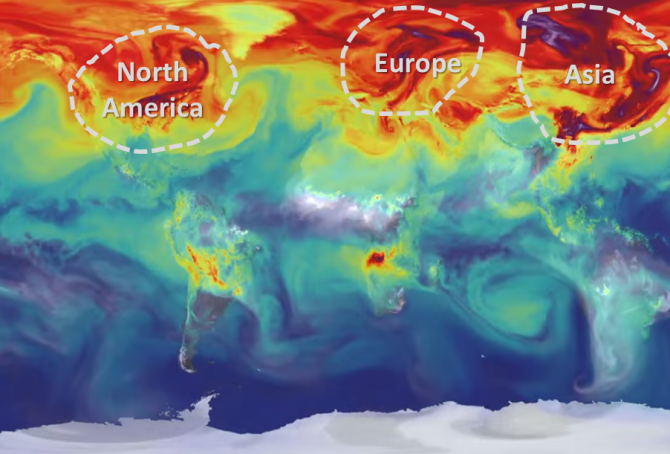
NASA video showing one year of carbon dioxide emissions swirling in the atmosphere
2014
‘NASA’ has released this simulated ‘video 3:10’ showing the global carbon dioxide emissions in 2006 in three minutes. The simulation illustrates plumes of CO2 swirling and shifting as winds disperse the emissions away from its sources. The animation also shows the swings in concentrations as the growth cycle of plants and trees changes with the seasons. ‘CO Emissions’ (monoxide) from forest fires are also visualized in the video.
Since 2006 the global CO2 Emissions from fossil fuels have increased by 14% and the CO2 content in the atmosphere has increased from 382 ppm in 2006 to 396 ppm in 2013. Below are ranked the twenty countries¹ with the largest CO2 Emissions per capita in 2012, with the climate dept per capita and the percentage of the global Climate Contribution (climate debt). The calculations of climate debt and the data of all countries are available in the menu ‘Calculations (Excel)’.
Climate change performance of Russia (compared to other BRICS countries)
2014
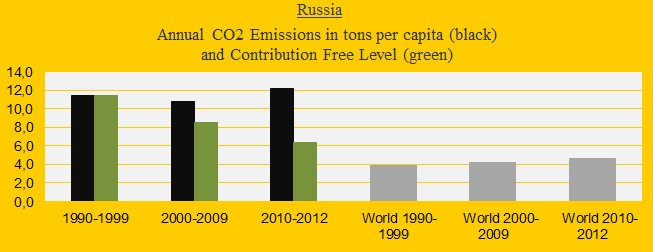
Russia was the 4th largest carbon dioxide emitter in 2012 with 5.6% of the global emissions, after China (26.9%), the United States (16.6%) and India (5.8%). The first diagram shows Russia’s CO2 Emissions per capita in decades in comparison with the world average (the green bars are the Contribution Free Level). After the COP summit in 2009 (at which China and the United States rejected a globally binding reduction agreement) the Russian emissions have increased dramatically and today the Russian Climate Contribution (climate debt) is $1,410 per capita (ranked 28th), compared to $627 in 2010 (ranked 32nd). See the ‘ranking’. The following analyzes the development in Putin’s Russia since 2000 in comparison with the other ‘BRICS‘ countries China, India, Brazil and South Africa – jointly emitting 41% of global carbon dioxide in 2012.
CO2 Emissions 2013: India is still Contribution Free (but how long?)
2014
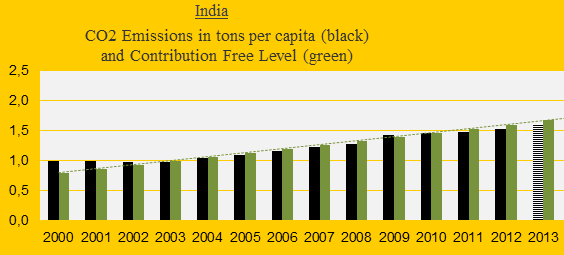
India was the 3rd largest emitter of carbon dioxide in 2013 (preliminary estimate), but the per capita emissions were only about one-third of the world average. The first diagram shows India’s CO2 Emissions per capita 2000-2013 (2013-emissions are preliminary estimates). The green bars are the Contribution Free Level in ClimatePositions. As long as emissions remain below the free level, on average, the climate debt is zero dollars. However, India balances close to the limit.
Climate change performance of the United States 2000-2013 (and the new emission target)
2014
Last week the United States ‘agreed’ with China to reduce US greenhouse gas emissions between 26% and 28% from the 2005-level by 2025. The agreement is legally non-binding and without the support of the Republicans. The following analyze the new US emission target (in the bottom) and the general performance in comparison with the spying buddies in Five Eyes Alliance¹: Canada, Australia, New Zealand and United Kingdom.
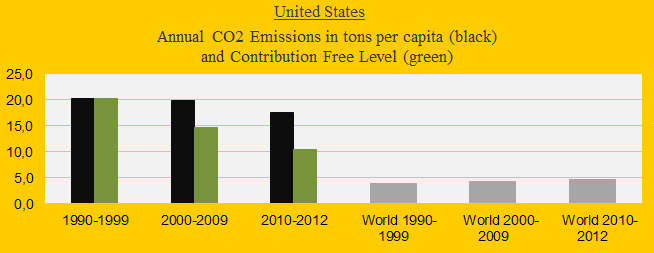
The United States is presently ranked 10th out of 147 countries in Climate Contribution (climate debt) per capita. See the ‘ranking’. The US ‘share of the global Climate Contributions’ is now 37.0%, compared to 40.7% in 2010. The first diagram shows the CO2 Emissions per capita in decades in comparison with the world average. The green bars are the Contribution Free Level, determined by the level of CO2 Emissions in the 1990s and the eleven ‘indicators’. The declining US share of the global climate debt is mainly due to reduced CO2 Emissions while the global emissions have increased.
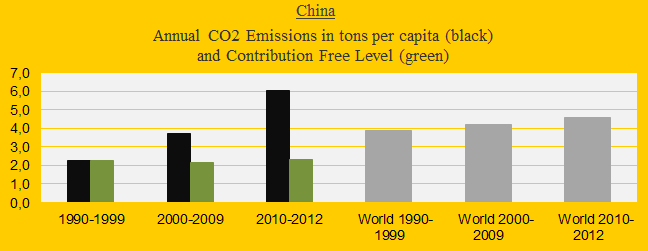
China’s growing climate debt and carbon dioxide emissions is catastrophic
2014
Today, China ‘agreed‘ with the United States (without the Republicans!?) that the Chinese CO2 Emissions can increase by 2030, after which emissions shall decrease. The agreement is legally non-binding and can almost be seen as a confirmation of the ‘worst case climate scenario‘. The first diagram shows the CO2 Emissions of China (the black bars) in decades in comparison with the world average (the grey bars). The green bars show the Chinese Contribution Free Levels in ClimatePositions. Today the Climate Contribution (climate debt) is $402 per capita and the ranking is 52nd out of 147 countries (see the ‘ranking’). The updated Chinese Climate Contribution is 10.3% of the global contribution, second only to the United States (see the ‘ranking’).
New ranking 2014 – update of 147 countries’ climate debt
2014
The data in ClimatePositions are updated consecutively and since the data year 2010 the eleven ‘indicators’ have all been updated.
The new rankings of 147 countries are now available in the menu “Contributions” (with six categories).
All country data and diagrams are available in the menu ‘Calculations (Excel)’. In the coming months selected countries will be analyzed in articles. The following illustrates the latest updates in two ways: 1) The change of climate debt as a percentage of the global climate debt of the twelve largest CO2 emitters, and 2) The key-figures of the United Kingdom.

IPCC worst case scenarios from 1990 and 2014 (in comparison with the actual global warming)
2014
In October 2014 IPCC’s Fifth Assessment Synthesis Report 2014 was released (IPCC = Intergovernmental Panel on Climate Change). The Summary for Policymakers (40 pages), the Headline Statements (2 pages), the Presentation (PowerPoint, 26 dias) and a Longer Report (116 pages) are available ‘here’. The four sub-reports 2013-2014 (a total of 5622 pages) are available ‘here’. The presentation of the gloomy message is overwhelming and totally confusing to common people (is that really necessary?).