The COP21 Paris Agreement: Diplomatic triumph, self-applause … and the carbon budget
2015
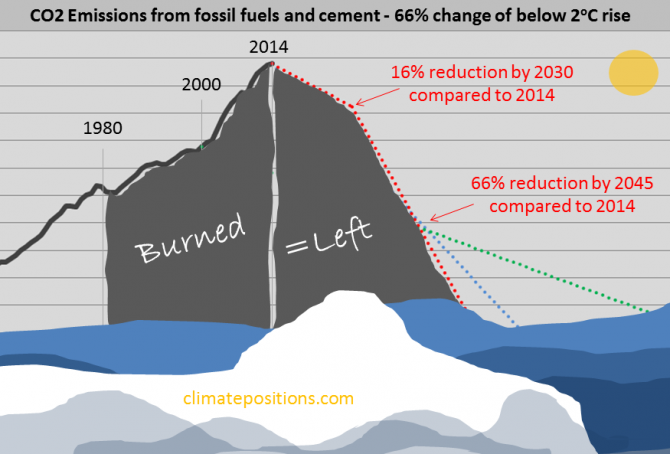
The COP21 ‘Paris Agreement’ (31 p), backed by 196 countries, emphasizes the urgent need to address the greenhouse gas emission gap between the aggregate effect of the 187 intended nationally defined contributions (INDCs/pledges) and the “aggregate emission pathways consistent with holding the increase in the global average temperature to well below 2°C above preindustrial levels and pursuing efforts to limit the temperature increase to 1.5°C”. This feverish understatement about the emission gab is clarified in the ‘Synthesis report (UN)’ on the aggregate effect of the pledges. The report says that the aggregate effect of the submitted pledges (INDCs) will bring the global cumulative CO2 Emissions up to around 72%–77% of the remaining carbon budget by 2030 (emitting 100% will leave the planet with 66% change of a temperature rise of less than 2°C). In other words: If the pledges are fulfilled perfectly, then three quarters of the remaining carbon budget will be used within 15 years … and thereafter emissions will have to dive deeply to zero before 2040. The critical situation is envisioned graphically below.

Preliminary Carbon Dioxide Emissions 2014, by country
2015
’The Global Carbon Project’ at Carbon Dioxide Information Analysis Center (CDIAC) has published preliminary CO2 Emissions from fossil fuels and cement for 2014, for more than 200 countries. The data is being used in a preliminary calculation of accumulated Climate Debt in ClimatePositions¹. The table below shows the estimated per capita emissions plus the updated Climate Debts, of the twenty largest total emitters (responsible for 77% of the global emissions in 2014).
2014-updates of GDP(ppp-$) … rising along with the temperature
2015
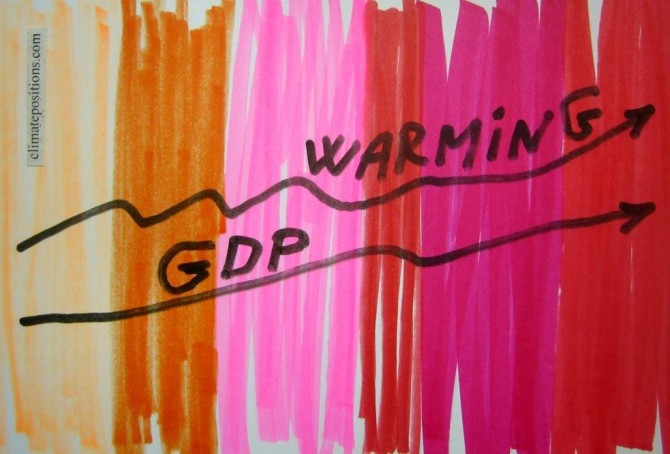
The national Climate Debt in ClimatePositions increases with growing GDP(ppp-$)¹. 2014-updates of GDP from ‘World Bank’ are now available in ‘Calculation (Excel)’. The world’s average per capita GDP(ppp-$) grew from $14,417 in 2013 to $14,939 in 2014. The diagram below shows the development in GDP(ppp-$) in 2000-2014 of the world average and five of the world’s largest per capita fossil fuel CO2 Emitters (in 2012): Qatar (50.8 tons of CO2), United Arab Emirates (44.0 tons), Singapore (38.8 tons), Bahrain (25.8 tons) and Saudi Arabia (22.0 tons).