
Forest Cover and Primary Forests 1990-2015 (two country groups are examined)
This article is sourced from two publications by ‘FAO’: ‘Forest Ecology and Management 2015 (pdf 145 p)’ and ’Global Forest Resources Assessment 2015 (pdf 253 p)’. The latter contains 46 different tables¹ with 234 countries and territories forest development 1990-2015.
Primary Forest is defined as naturally regenerated forest of native species, where there are no clearly visible indications of human activities and the ecological processes are not significantly disturbed. Today, Primary forest accounts for 32% of global Forest Cover and has apparently increased by around 6.8% between 1990 and 2015, however, this increase is largely due to the fact that more countries have submitted data for the statistic. This taken into account, an overall global Primary Forest loss of 2.5%, since 1990, is more likely (and 10.0% loss in the tropics).
Update 2016: Climate financing as share of Climate Debt, by country
[Modified version posted 17 June 2016] ‘Climate Funds Update’ is an independent website providing information on climate finance designed for developing countries to address climate change. The data is based on information received from 25 multilateral, bilateral, regional and national climate funds and the funding is largely up to date by the end of May 2016. A total of $21 billion has currently been funded (money deposited), of which around 95% is country-sourced. The global climate finance has increased by approximately 24% since October 2015 (in seven months). The table below shows the Climate Debt per capita in ClimatePositions, the per capita climate financing (funding) to developing countries and the climate financing as share of the Climate Debt.
The table includes 35 countries with both climate financing and Climate Debt in ClimatePositions (only countries with full data in ClimatePositions are included).
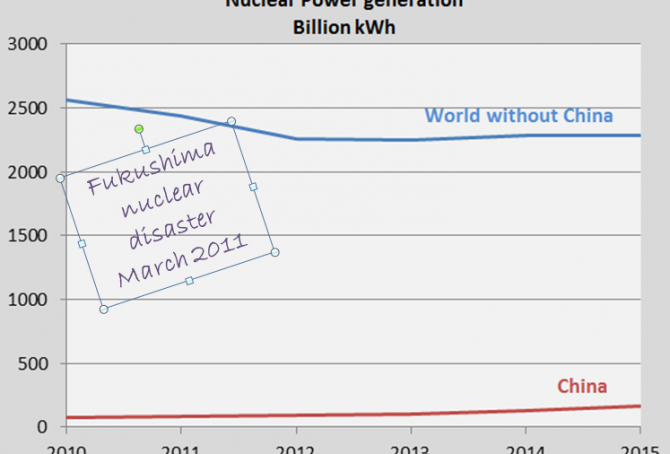
World’s Nuclear Power generation 2015: 1.3% growth compared to 2014
The world’s Nuclear Power generation increased by 1.3% in 2015 compared to 2014 (and 4.0% increase compared to 2012). The table below shows the generation in billion kWh of all Nuclear Power nations and the global generation, since 2010. China increased the generation by 30.2% in 2015 compared to 2014, while the rest of the world the decreased the generation by 0.3%. The global generation level in 2015 is still 7.1% below the 2010-level.

Climate Debt: Norway ranks 9th (performance of top twenty from Human Development Index)
The so called ‘Human Development Index 2015’ (UN) ranks Norway 1st among 188 countries. The index is based on 1) Life expectancy at birth, 2) Expected years of schooling, 3) Mean years of schooling and 4) Gross national income (GNI) per capita. However, the wealthy Scandinavian oil state ‘Ranks‘ 9th among 148 countries on Climate Debt per capita. Norway is in other words a highly human developed demolisher of the climate, one might say! The following examines the climate performance of Norway in comparison with the other top five countries from Human Development Index: Australia, Switzerland, Denmark and Netherland.