Global Indicator Update: Land Temperature 2016 (warmest year on record)
2017
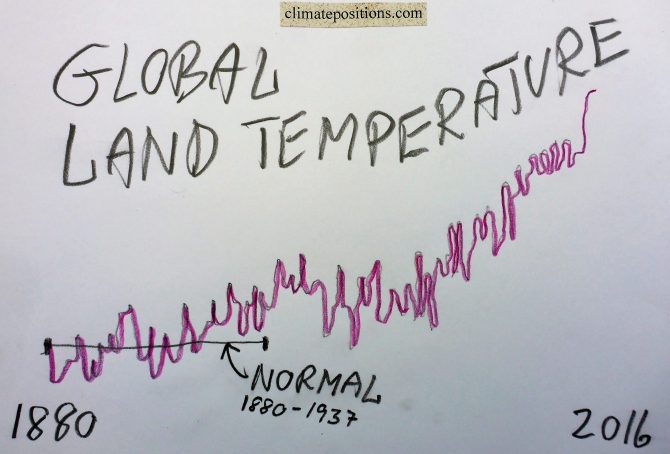
The year 2016 was by far the hottest on planet Earth since measurements began in 1880. Both global Land (air) Temperature and Ocean (air) Temperature were the hottest on record. See the development in Land Temperature between 1960 and 2016 in the diagram below. The average temperature rise 1880-1937 is set at 0°C (baseline 1880-1937) and 2016 was 1.73°C warmer. The development since 1880 in Land Temperature and Ocean Temperature (and the two combined) are available at ‘ncdc.noaa.gov‘.
Added 22-01-17: The Ocean Temperature 2016 was 0.94°C warmer compared to baseline 1880-1937, and Land and Ocean Temperature combined was 1.15°C warmer. Note that other sources may refer to baseline 1881-1910 or even 1951-1980.
Added 07-02-2017: Soon, the global temperature ‘Indicator’ in ClimatePosition will be changed from Land (air) Temperature (10-years average) to Land/Ocean (air) Temperature (10-years average). The change will not affect the current accumulated Climate Debt of any country, only the future calculation.

Global Indicator Updates 2016: Sea Level, Population and CO2 Content in the atmosphere
2017
The estimated annual global Sea Level rise since 1993 increased from 3.3 mm (±0.4 mm) in 2015 to 3.4 mm (±0.4 mm) in 2016. The increase suggests an accelerating rate of Sea Level rise, which is illustrated in the diagram below. The growing volume of the oceans is caused by two effects of global warming: melting ice and warmer oceans. In ClimatePositions the Sea Level rise between 1880 and 1993 is set at 1.2 mm annually, or 14 cm during the 113-year period. The total estimated Sea Level rise between 1880 and 2016 adds up to 21.82 cm and this figure is used as an ‘Indicator‘ in ClimatePositions.
The Sea Level rise between 2004 and 2016 is shown below (Sea Level 1880 and 1993 is set at 0 cm and 14 cm, respectively) – the unscientific polynomial trend line projects the scary tendency by 2100.