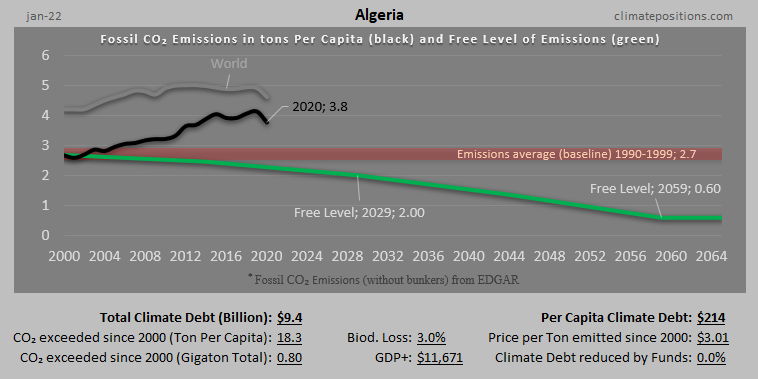

Algeria – per capita Fossil CO2 Emissions and Climate Debt
2020
Algeria’s current Climate Breakdown Pricing amounts to $5.56 per tons Fossil CO2 emitted since 2000. The Climate Debt grew from $150 per capita in 2015 to $346 in 2020. Updated Rankings of 165 countries are available in the menu “Climate Debt”.
The following diagrams expose the trends of Fossil CO2 Emissions, Climate Debt, GDP(ppp-$) and Ecological Footprint without carbon.

Egypt – per capita Fossil CO2 Emissions and Climate Debt
2020
Egypt’s current Climate Breakdown Pricing amounts to $3.58 per tons Fossil CO2 emitted since 2000. The Climate Debt grew from $79 per capita in 2015 to $161 in 2020. Updated Rankings of 165 countries are available in the menu “Climate Debt”.
The following diagrams expose the trends of Fossil CO2 Emissions, Climate Debt and GDP(ppp-$).
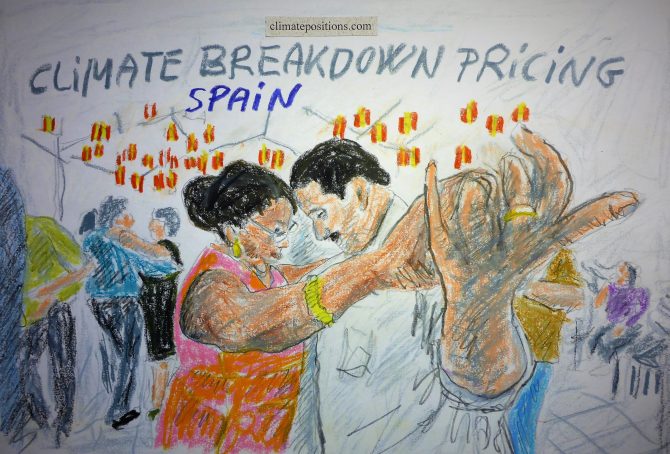
Spain – per capita Fossil CO2 Emissions and Climate Debt
2020
Spain’s current Climate Breakdown Pricing amounts to $16.05 per tons Fossil CO2 emitted since 2000. The Climate Debt grew from $1,173 per capita in 2015 to $2,110 in 2020. Updated Rankings of 165 countries are available in the menu “Climate Debt”.
The following diagrams expose the trends of Fossil CO2 Emissions, Climate Debt, GDP(ppp-$) and Ecological Footprint without carbon.
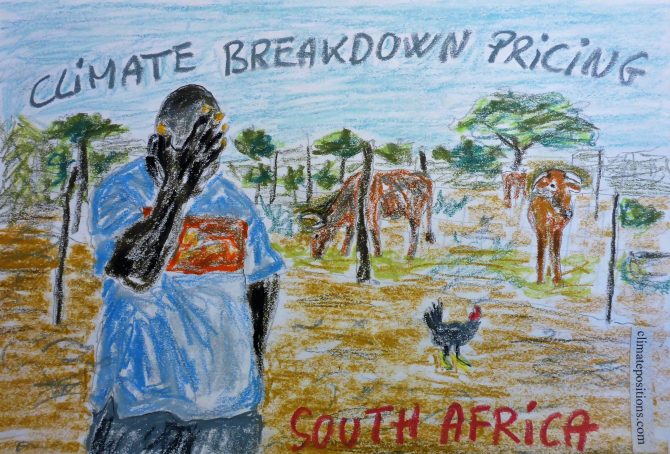
South Africa – per capita Fossil CO2 Emissions and Climate Debt
2020
South Africa’s current Climate Breakdown Pricing amounts to $8.30 per tons Fossil CO2 emitted since 2000. The Climate Debt grew from $593 per capita in 2015 to $1,355 in 2020. Updated Rankings of 165 countries are available in the menu “Climate Debt”.
The following diagrams expose the trends of Fossil CO2 Emissions, Climate Debt, GDP(ppp-$) and Ecological Footprint without carbon.
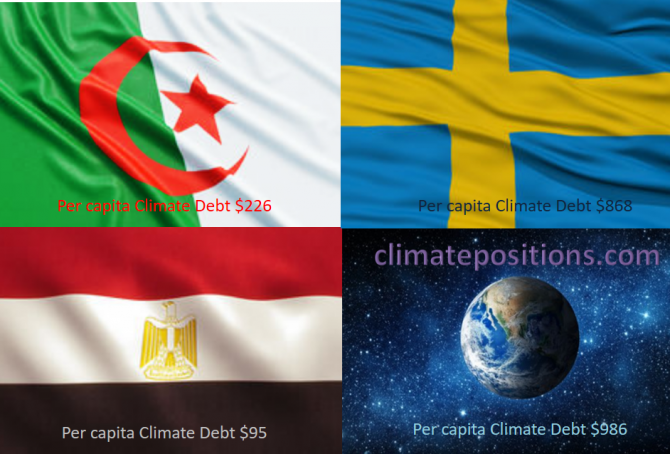
Share of global Climate Debt rank 46th, 47th and 48th: Algeria, Egypt and Sweden (combined responsible for 0.37% of Climate Debt and 1.18% of Fossil CO2 Emissions 2016)
2017
The diagram below shows ‘Share of global Climate Debt‘ in 2010, 2015 and 2017 of Algeria, Egypt and Sweden (ranked 46th, 47th and 48th). The Algerian share has increased continuously, whereas the Egyptian and the Swedish shares appear to have peaked around 2015.
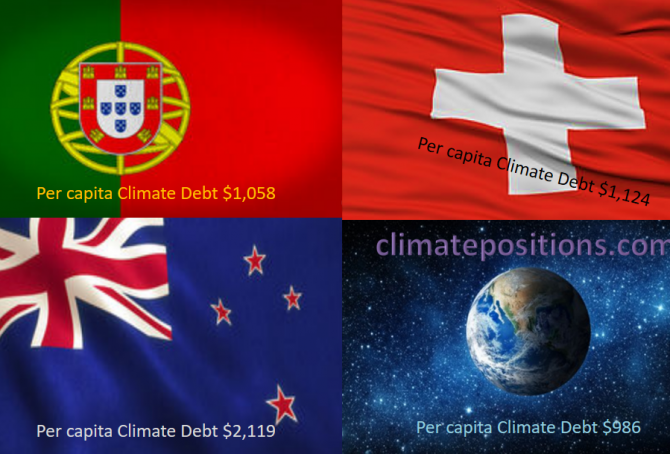
Share of global Climate Debt rank 43rd, 44th and 45th: Portugal, New Zealand and Switzerland (combined responsible for 0.42% of Climate Debt and 0.34% of Fossil CO2 Emissions 2016)
2017
The diagram below shows ‘Share of global Climate Debt‘ in 2010, 2015 and 2017 of Portugal, New Zealand and Switzerland (ranked 43rd, 44th and 45th). The shares of Portugal and New Zealand are decreasing, whereas the Swiss share is stable.
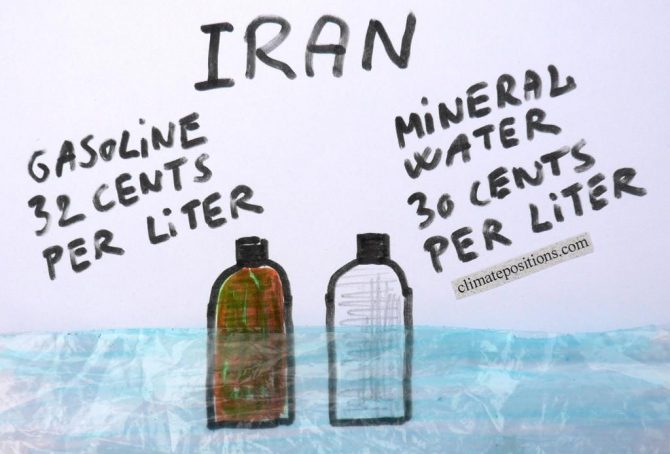
Climate Debt: Iran ranks 33rd (performance of the twenty most populous Muslim countries)
The twenty most populous countries with more than 85% Muslim majority (here called Muslim-20) represent 16.2% of the global population and 7.3% of the global Climate Debt in ClimatePositions. The average climate performance of the Muslim world is superior to the world average, so to speak. Among Muslim-20 Iran ranks 2nd (33rd among 148 countries) on Climate Debt per capita only surpassed by the climate-change-monster of Saudi Arabia.
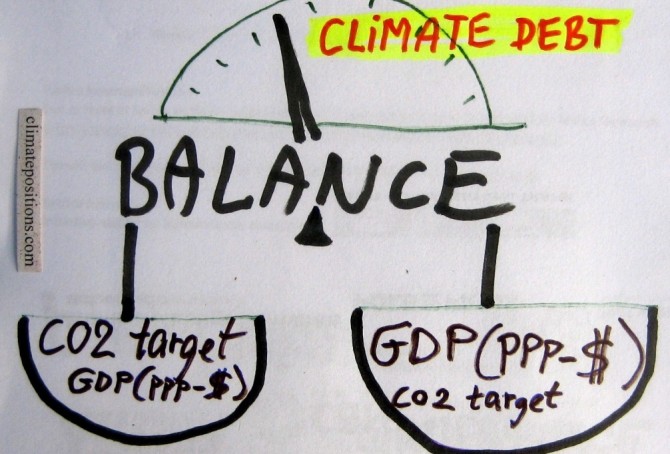
Analyses of the global CO2 target and GDP(ppp-$)
2015
The calculation of Climate Debt in ClimatePositions is based on a balance between many ‘indicators’ and a common global per capita CO2 target. To illustrate the nature of this balance twelve countries are analyzed in this article in terms of the indicator of GDP(ppp-$) and the global CO2 target. The 12-Countries Group represents 38% of the global population, 65% of the global CO2 Emissions from fossil fuels and around 70% of the global Climate Debt.

Climate change performance of Libya, Algeria, Tunisia and Morocco (refugees and the European Union)
2015
A devilish combination of poverty, armed conflict and violence in parts of Africa and Middle East, sends flows of refugees in boats across the Mediterranean Sea to Europe via Spain, Italy, Malta and Greece. In 2014 around 150,000 survived the dangerous trip to Italy alone. However, the European Union (EU) offers (as it seems) only a total of 5,000 resettlement places across Europe and the vast majority of all refugees will be sent back as irregular migrants. Read this ‘article’ from The Guardian.