Greece: Per Capita Climate Debt $1,543 (Ranked 39) – Fossil CO2 Emissions
In 2024, Greece is responsible for 0.21% of the Global Climate Debt accumulated since 2000. Below are some key figures in the calculations.
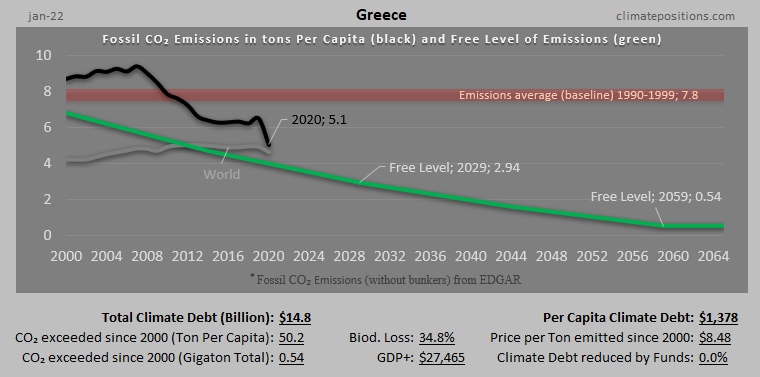
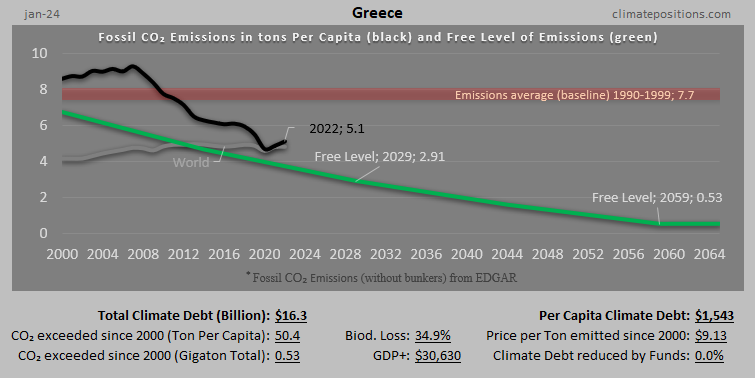
Greece – per capita Fossil CO2 Emissions and Climate Debt
2020
The current Climate Breakdown Pricing of Greece amounts to $12.76 per tons Fossil CO2 emitted since 2000. The Climate Debt grew from $1,256 per capita in 2015 to $1,929 in 2020. Updated Rankings of 165 countries are available in the menu “Climate Debt”.
The following diagrams expose the trends of Fossil CO2 Emissions, Climate Debt, GDP(ppp-$) and Ecological Footprint without carbon.
Turkey – per capita Fossil CO2 Emissions and Climate Debt
2020
Turkey’s current Climate Breakdown Pricing amounts to $13.04 per tons Fossil CO2 emitted since 2000. The Climate Debt grew from $401 per capita in 2015 to $1,040 in 2020. Updated Rankings of 165 countries are available in the menu “Climate Debt”.
The following diagrams expose the trends of Fossil CO2 Emissions, Climate Debt, GDP(ppp-$) and Ecological Footprint without carbon.
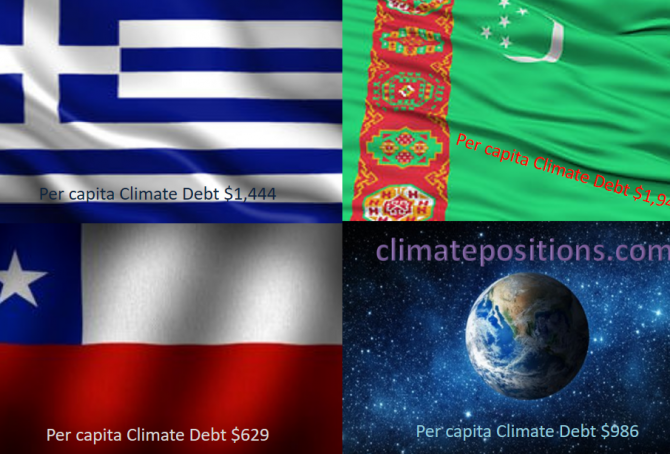
Share of global Climate Debt rank 40th, 41st and 42nd: Greece, Chile and Turkmenistan (combined responsible for 0.52% of Climate Debt and 0.64% of Fossil CO2 Emissions 2016)
2017
The diagram below shows ‘Share of global Climate Debt‘ in 2010, 2015 and 2017 of Greece, Chile and Turkmenistan (ranked 40th, 41st and 42nd). The share of Greece is decreasing, while the shares of Chile and Turkmenistan are increasing.
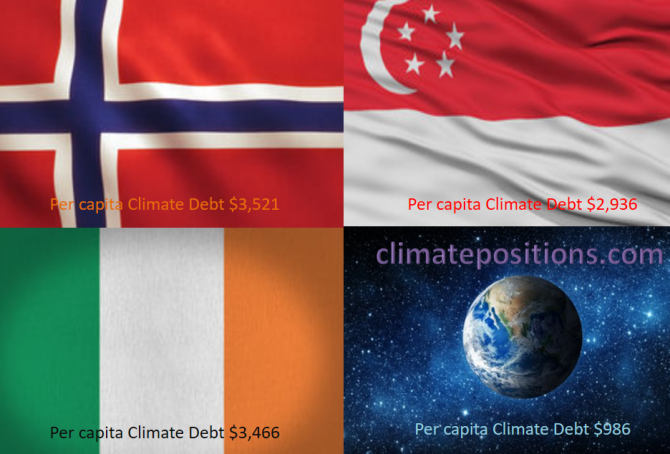
Share of global Climate Debt rank 37th, 38th and 39th: Norway, Ireland and Singapore (combined responsible for 0.71% of Climate Debt and 0.37% of Fossil CO2 Emissions 2016)
2017
The diagram below shows ‘Share of global Climate Debt‘ in 2010, 2015 and 2017 of Norway, Ireland and Singapore (ranked 37th, 38th and 39th). Norway’s share is decreasing, whereas Singapore’s is increasing. Ireland’s impressive decrease seems to have reversed lately.
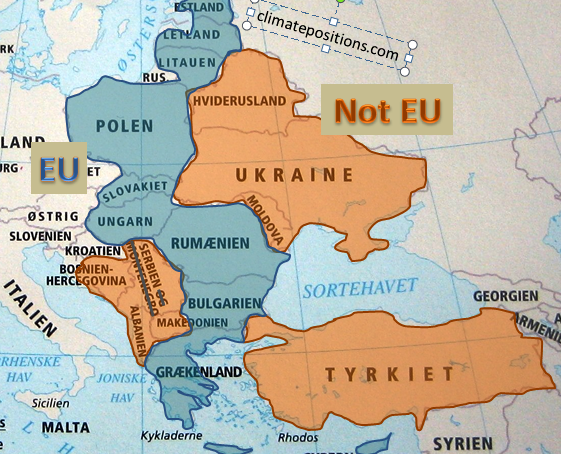
European Union “east” compared to bordering countries
2015
The ‘European Union’ (EU) is an economic and political partnership between ‘28 countries’. Around 7% of the global population lives in EU and they emit around 12% of the global CO2 from fossil fuels and are responsible of 13% of the Climate Debt in ClimatePositions. The following examines a group of 10 countries in eastern EU which joined the union between 1981 and 2007 in comparison with 8 bordering countries.
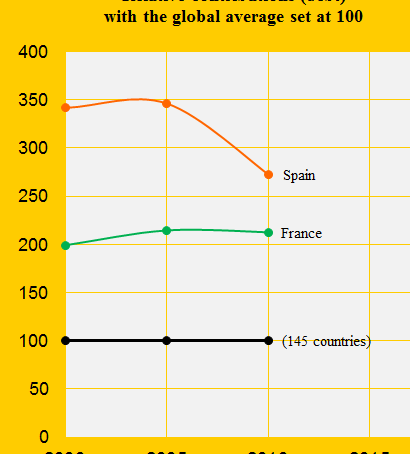
Climate performance: France versus Spain
2013
France was the 26th and Spain the 23rd worst performing country out of 145 in ClimatePositions 2010. As illustrated in the above diagram, the difference in the Contributions (climate debt) has narrowed between 2005 and 2010. Both countries have improved three rankings since 2005. See the full country list in the menu “Contributions/Per Capita US$ Rank”. The following examines the CO2 Emissions, forest area, GDP(ppp-$) and the world’s shares (Population, CO2 Emissions, GDP and Climate Contributions) of the two countries.