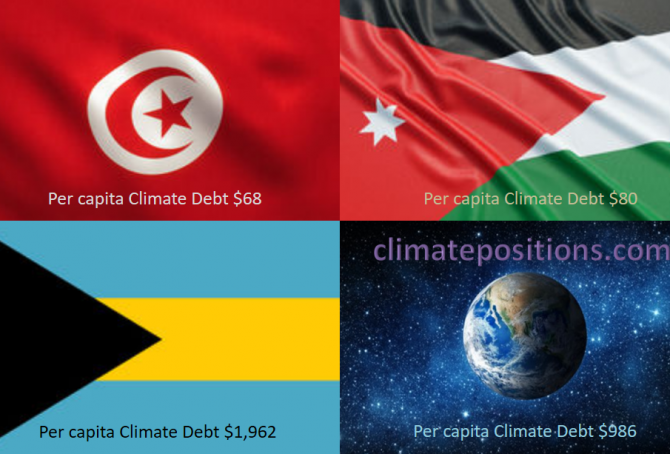
Share of global Climate Debt rank 76th, 77th and 78th: Tunisia, Bahamas and Jordan (combined responsible for 0.03% of Climate Debt and 0.16% of Fossil CO2 Emissions 2016)
2018
The diagram below shows ‘Share of global Climate Debt‘ in 2010, 2015 and 2017 of Tunisia, Bahamas and Jordan (ranked 76th, 77th and 78th). The share of Tunisia is continuously declining, whereas the shares of Bahamas and Jordan are uneven.
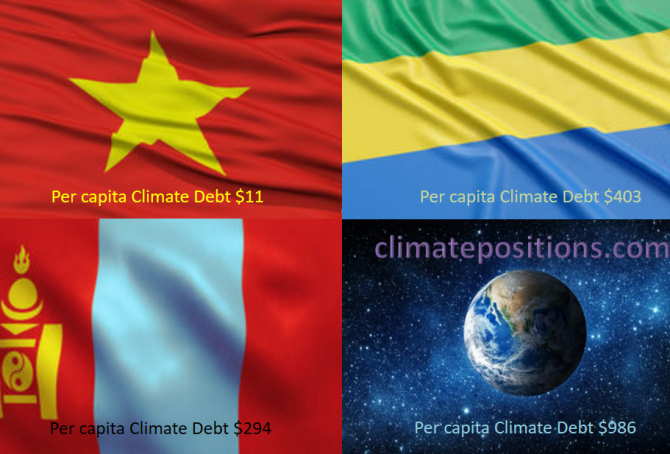
Share of global Climate Debt rank 73rd, 74th and 75th: Vietnam, Mongolia and Gabon (combined responsible for 0.04% of Climate Debt and 0.64% of Fossil CO2 Emissions 2016)
2018
The diagram below shows ‘Share of global Climate Debt‘ in 2010, 2015 and 2017 of Vietnam, Mongolia and Gabon (ranked 73rd, 74th and 75th). The shares of Vietnam and Mongolia are both growing continuously. Vietnam and Gabon had zero Climate Debt in 2010.
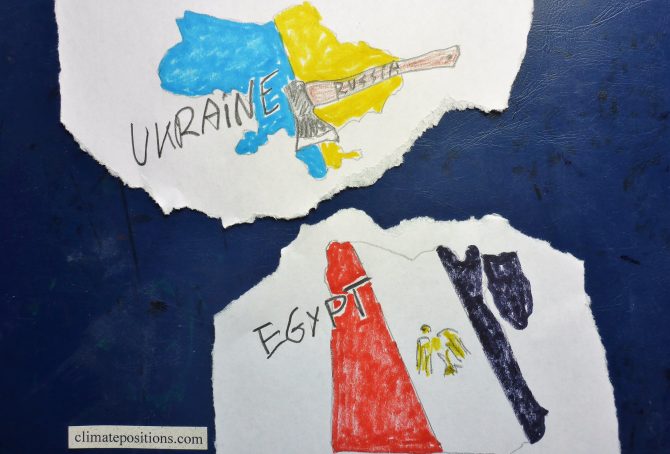
Climate change performance: Egypt vs. Ukraine
Egypt and Ukraine are the world’s 25th and 26th largest emitters of CO2 from Fossil Fuels and cement. Combined, the two countries were responsible for 1.2% of global CO2 Emissions in 2015. The following examines the ‘Indicators‘ of CO2 Emissions, GDP(ppp-$), Ecological Footprint and the Ukrainian Nuclear Power.
The diagrams below show the per capita CO2 Emissions from Fossil Fuel (without bunkers) and cement, since 2000. The green bars show the Free Emission Level¹ – the exceedance is the basis for calculating the national Climate Debt.

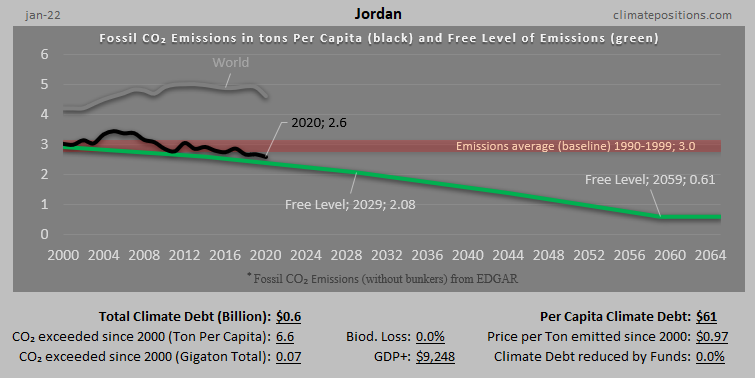
Climate change performance of Israel, Lebanon and Jordan (refugees from the Syrian Civile War)
2015
The ‘Syrian Civil War’ and other violent conflicts in the region are causing huge numbers of refugees. According to ‘The UN Refugee Agency (UNHCR)’ around 1.2 million refugees lived in Lebanon by December 2014, which was 28% of the usual population. In Jordan, the percentage of refugees was 10% and in Israel 0.5%. For comparison, the world average is about 0.8% (60 million refugees globally). Under these tragic circumstances carbon dioxide emissions and Climate Debt is of cause inconsiderate to discuss, but on the other hand, manmade climate destruction also causes mass refugees, mutilation and death … with increasing force in the coming decades. Experts foresee about 200 million climate refugees by 2050, or about 2% of the projected global population of 10 billion. Or roughly speaking: Two-thirds more refugees, due to climate change alone, in a world with one-third more people – in 35 years.

Climate performance of Israel, Occupied Palestinian Territories and neighboring countries
2014
Israel was the 16th worst performing country out of 145 in ClimatePositions 2010 with a Climate Contribution of $1,790 per capita (see the ranking in the menu “Calculation”). The Palestinian Territories (Gaza Strip and West Bank, both occupied by Israel) were in reality Contribution Free (though excluded from the inventory due to lack of indicator data¹). The following examines the statistics of Israel, the Occupied Palestinian Territories, Lebanon, Jordan, Syria and Egypt.