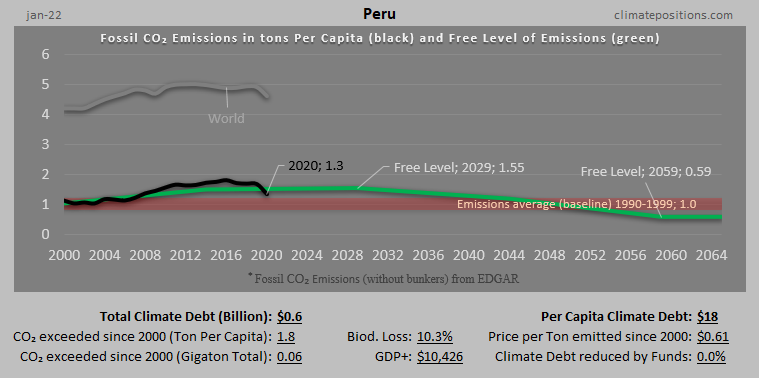
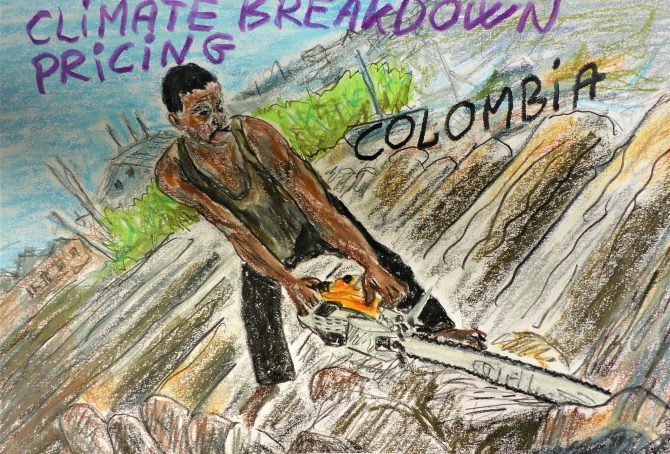
Colombia – per capita Fossil CO2 Emissions (zero Climate Debt)
2020
Although Colombia’s accumulated Climate Debt is zero, the country is the world’s 45th largest emitter of Fossil CO2.
The following diagrams expose the trends of Fossil CO2 Emissions, GDP(ppp-$), Forest Cover, Primary Forest and Environmental Performance.
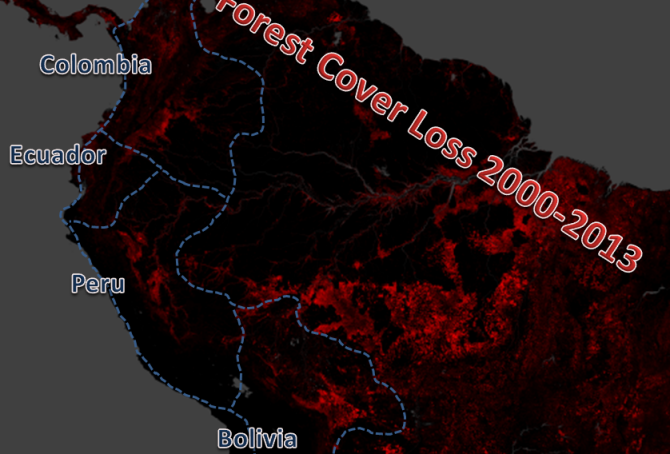
Climate change performance of Ecuador, Bolivia, Colombia and Peru
2015
1.4% of the global population lives in Ecuador, Bolivia, Colombia or Peru, and together they emitted 0.6% of the global CO2 from fossil fuels in 2012. Ecuador’s updated Climate Debt per capita is $84 and Bolivia’s is $18. Colombia and Peru are both Contribution Free. See the ‘ranking’ by November 2014. The following examines the indicators of CO2 Emissions (carbon dioxide from fossil fuels), Forests and GDP(ppp-$).
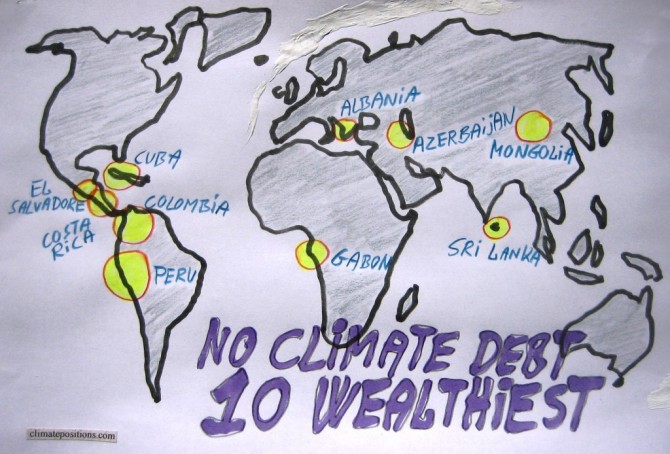
The ten wealthiest countries without any Climate Debt
2015
Among the 147 countries with full data in ClimatePositions 65 are Contribution Free (no Climate Debt). See the ‘ranking’. The table in this article ranks (from 1 to 10) the ten wealthiest Contribution Free countries by the following eight indicators:
- Per capita GDP(ppp-$) (1 = wealthiest)
- Income Equality (1 = most equal)
- Per capita CO2 Emissions from fossil fuels (1 = lowest emissions)
- Democracy Index (1 = most democracy)
- Environmental Performance (1 = best performance)
- Life Expectancy by birth (1 = longest lives)
- Per capita Ecological Footprint without carbon (1 = smallest footprint)
- Primary Forests as a percentage of the total land area (1 = largest percentage)
Read the comments below the table.
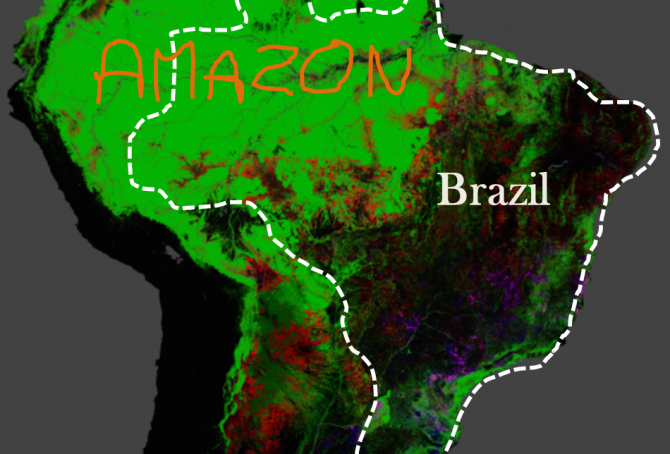
Brazil’s rainforests and climate change performance
2014
The Google map of the Amazon is from the new interactive ‘Global Forest Change‘ developed by The University of Maryland (read ‘more’). The red is Forest Loss from 2000 to 2012, the blue is Forest Gain and the green is Forest Extent (unchanged). The purple is areas of mixed Forest Loss and Forest Gain. According to Brazil’s environment minister the lowest recorded deforestation of Brazil since 1988, was in 2012. Furthermore, up to a third of the cleared rainforest over the past decades may be on the way back (regrowth).
Forest Cover, Primary Forests and climate debt
2014
The national data of Forest Cover and Primary Forest are both included in the calculations of Climate Contributions (debt) in ClimatePositions. Primary Forest was included as an indicator in the worksheet in August 2014. The following describes selected findings on forests from FAO’s ‘The Global Forest Resources Assessments (FRA), 2010’ (main report, pdf, 378 pages). The Assessment is based on two primary sources of data: 1) ‘country reports’ and 2) remote sensing conducted by FAO and partners.