Portugal: Per Capita Climate Debt $1,105 (Ranked 45) – Fossil CO2 Emissions
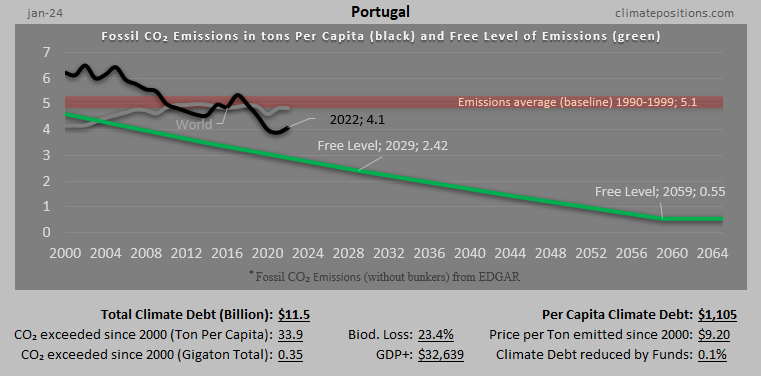
In 2024, Portugal is responsible for 0.15% of the Global Climate Debt accumulated since 2000. Below are some key figures in the calculations.


Spain – per capita Fossil CO2 Emissions and Climate Debt
2020
Spain’s current Climate Breakdown Pricing amounts to $16.05 per tons Fossil CO2 emitted since 2000. The Climate Debt grew from $1,173 per capita in 2015 to $2,110 in 2020. Updated Rankings of 165 countries are available in the menu “Climate Debt”.
The following diagrams expose the trends of Fossil CO2 Emissions, Climate Debt, GDP(ppp-$) and Ecological Footprint without carbon.
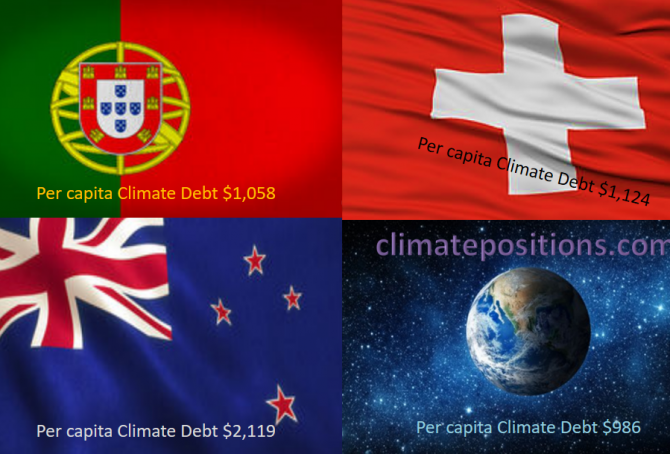
Share of global Climate Debt rank 43rd, 44th and 45th: Portugal, New Zealand and Switzerland (combined responsible for 0.42% of Climate Debt and 0.34% of Fossil CO2 Emissions 2016)
2017
The diagram below shows ‘Share of global Climate Debt‘ in 2010, 2015 and 2017 of Portugal, New Zealand and Switzerland (ranked 43rd, 44th and 45th). The shares of Portugal and New Zealand are decreasing, whereas the Swiss share is stable.
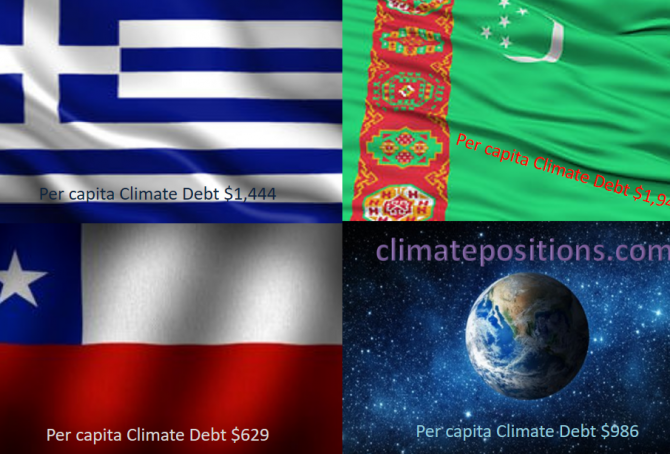
Share of global Climate Debt rank 40th, 41st and 42nd: Greece, Chile and Turkmenistan (combined responsible for 0.52% of Climate Debt and 0.64% of Fossil CO2 Emissions 2016)
2017
The diagram below shows ‘Share of global Climate Debt‘ in 2010, 2015 and 2017 of Greece, Chile and Turkmenistan (ranked 40th, 41st and 42nd). The share of Greece is decreasing, while the shares of Chile and Turkmenistan are increasing.

Climate change performance: Malaysia vs. Spain
2017
Malaysia and Spain are the world’s 23rd and 24th largest emitters of CO2 from Fossil Fuels and cement. Combined, the two countries were responsible for 1.4% of world CO2 Emissions in 2015. The following examines the ‘Indicators‘ of CO2 Emissions, GDP(ppp-$), Forest Cover (and Primary Forest) and Environmental Performance.
The diagrams below show the per capita CO2 Emissions from Fossil Fuel (without bunkers) and cement, since 2000. The green bars show the Free Emission Level¹ – the exceedance is the basis for calculating the national Climate Debt. The Spanish reductions are pretty much balanced by the Malaysian increases … which is world symptomatic.
Climate Change Performance Index 2013
2013
‘Climate Change Performance Index 2013’ is a ranking of 58 countries that was published recently by ‘Germanwatch’ and ‘Climate Action Network Europe’ – with the help of over 230 experts worldwide. 80% of the evaluation is based on indicators of emissions (30% for emissions levels and 30% for recent development of emissions), efficiency (5% level of efficiency and 5% recent development in efficiency) and renewable energy (8% recent development and 2% share of total primary energy supply). For the first time emissions from deforestation is included. The remaining 20% of the evaluation is based on national and international climate policy assessments by experts from the respective countries.