Climate change performance of Venezuela, Chile and Mexico
2015
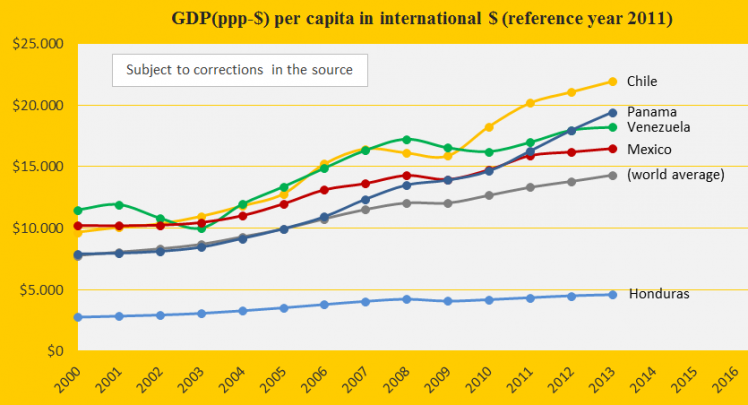
Venezuela, Chile and Mexico are ranked 42nd, 44th and 58th among 147 countries on the worst performing list in ClimatePositions (see the ‘ranking’). Their updated Climate Contributions (climate debt) are respectively $697, $561 and $313 per capita. The first diagram shows the GDP(ppp-$) per capita of the three countries, in comparison with Panama, Honduras and the world average. Chile is the third wealthiest country in the America’s after (far after!) the United States and Canada – Honduras is the second poorest after Nicaragua.
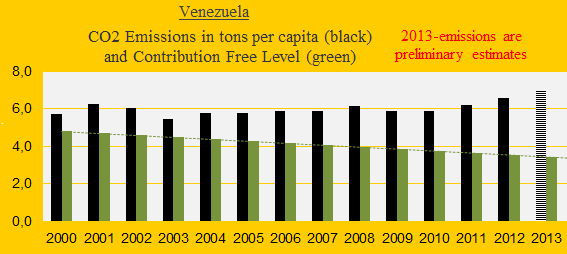
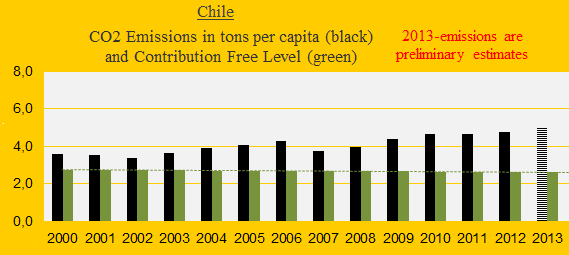
The three diagrams below show the CO2 Emissions (carbon dioxide from fossil fuels) in tons per capita since 2000 of Venezuela, Chile and Mexico. The green bars show the Contribution Free Level determined by the national CO2 Emission level in the 1990s and a range of updated ‘indicators‘. The black bars minus the green bars is the CO2 Emission exceedance, from which the Climate Contribution is calculated¹. The Venezuelan CO2 Emissions have increased from 5.8 tons per capita in 1990s to 6.6 in 2012 (CO2 emission exceedance 2000-2013 is 26.6 tons per capita) – the corresponding emissions of Chile were 2.9 to 4.8 tons (the exceedance is 19.9 tons) and of Mexico 3.6 to 3.9 tons (the exceedance is 13.4 tons).

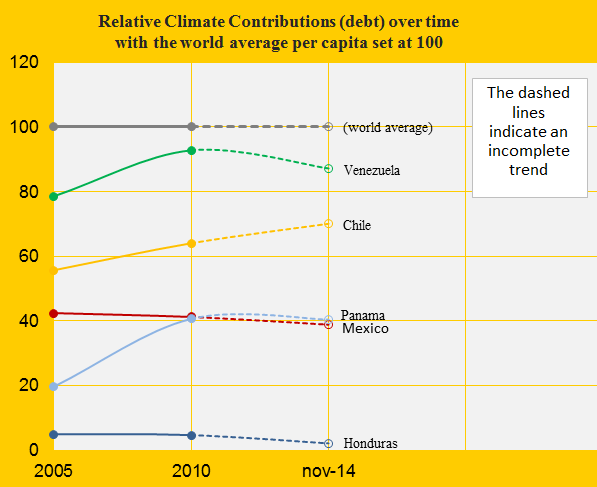
The next diagram (below) shows the relative Climate Contributions (climate debt) since 2005 of Venezuela, Chile, Mexico, Panama and Honduras, with the world average set at 100. Economic growth without appropriate CO2 Emission reductions (and other environmental actions) leads to an up-going curve, as of Chile. Note that the dashed lines are incomplete trends based on preliminary estimates.
The diagram below shows the countries’ Climate Contribution (climate debt) calculated as a percentage of the national GDP(ppp-$) annually since the starting year 2000. Among these countries, only Honduras has lowered the annual debt-share. Calculated this way Venezuela is the 38th worst performing country among 147 (see the ‘ranking’).

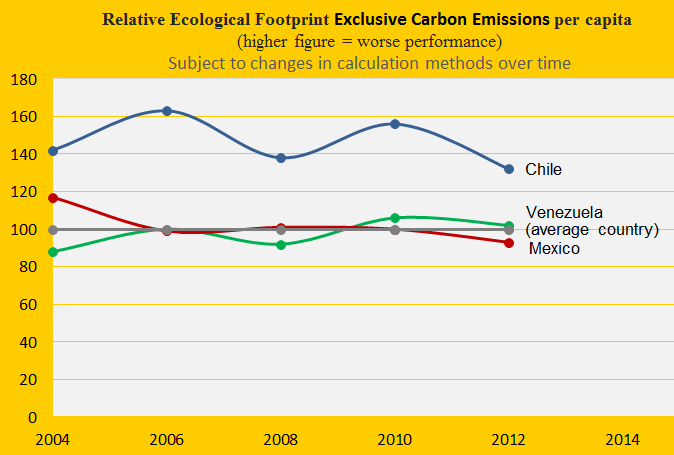
The ‘Ecological Footprint’ tends to grow along with economic growth, unless the policy supports sustainability. The diagram below shows the Ecological Footprint without CO2 Emissions2 of the three countries, with the world average set at 100. The Chilean footprint (without CO2) was ranked 36th among 155 countries in 2012 (report from 2014).
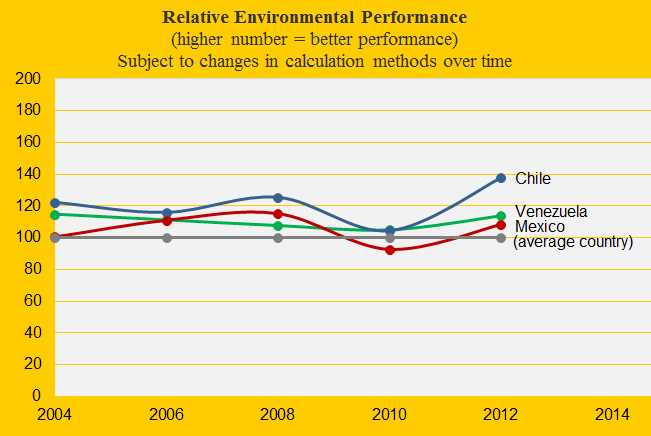
The ‘Environmental Performance’ tend to be more domestically focused and rich countries often perform better than poor (environmental problems are often exported to developing countries). See the relative performance of the three countries, with the average of 180 countries set at 100 in the diagram below. Examine the detailed scores at the sourse: ‘Venezuela’ (ranked 57), ‘Chile’ (ranked 29) and ‘Mexico’ (ranked 65).
¹The CO2 Emission exceedance is converted to climate debt by means of the national GDP(ppp $) and the indicators Global Temperature and Sea Level.
²This includes CO2 Emissions from fossil fuels, flaring of gas, cement production and tropical forest fires.
.
Information on national GDP(ppp-$) per capita: Worldbank (links in the menu “Calculations”).
Source on CO2 Emissions: EIA, U.S. Energy Information Administration and data on preliminary national CO2 Emissions are from Global Carbon Project (links in the menu “Calculations”).
Source on Ecological Footprint: WWF reports “The Living Planet” published 2006-2014 (links in the menu “Calculations”).
Source on Environmental Performance: Yale and Columbia University reports, published 2006-2014 (links in the menu “Calculations”).
Comments are closed.