Climate Debt worldwide
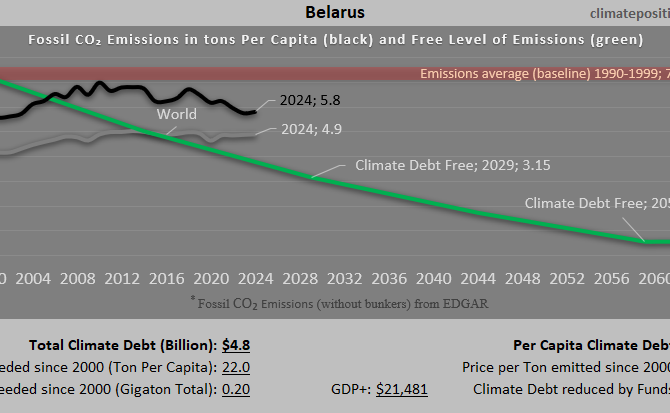
Climate Debt of Belarus 2025: $4.8 Billion or 0.05% of the Global Climate Debt (or $526 Per Capita)
/2025/ Belarus ranks 63rd in Climate Debt Per Capita accumulated 2000-2025. Below are some key figures in the calculations. The diagram above shows the Fossil CO2 Emissions Per Capita and the Free Level of emissions (green). The wide straight red line shows emissions in the 1990s (baseline in the calculations).
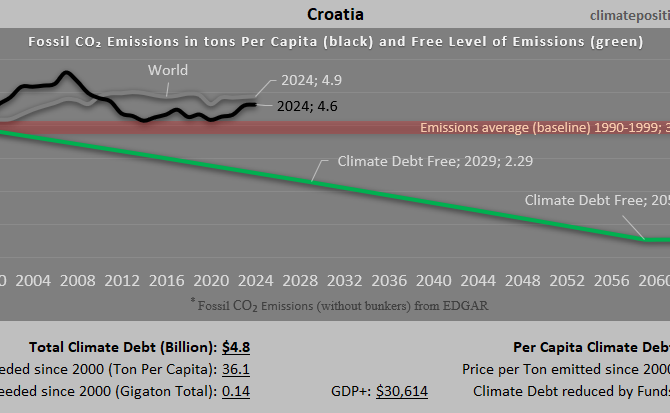
Climate Debt of Croatia 2025: $4.8 Billion or 0.05% of the Global Climate Debt (or $1229 Per Capita)
/2025/ Croatia ranks 46th in Climate Debt Per Capita accumulated 2000-2025. Below are some key figures in the calculations. The diagram above shows the Fossil CO2 Emissions Per Capita and the Free Level of emissions (green). The wide straight red line shows emissions in the 1990s (baseline in the calculations).

Climate Debt of Luxembourg 2025: $4.3 Billion or 0.05% of the Global Climate Debt (or $6411 Per Capita)
/2025/ Luxembourg ranks 12th in Climate Debt Per Capita accumulated 2000-2025. Below are some key figures in the calculations. The diagram above shows the Fossil CO2 Emissions Per Capita and the Free Level of emissions (green). The wide straight red line shows emissions in the 1990s (baseline in the calculations).
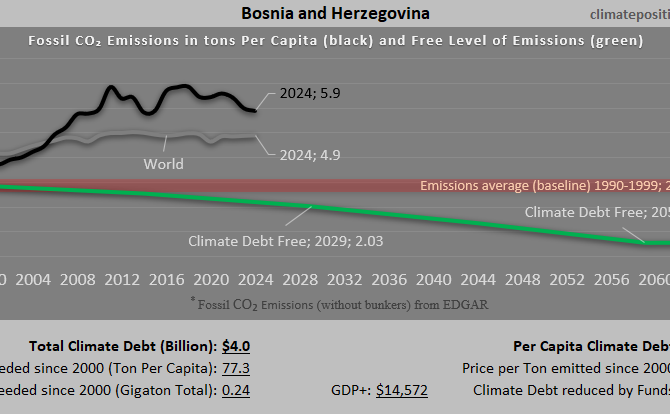
Climate Debt of Bosnia and Herzegovina 2025: $4.0 Billion or 0.04% of the Global Climate Debt (or $1252 Per Capita)
/2025/ Bosnia and Herzegovina ranks 45th in Climate Debt Per Capita accumulated 2000-2025. Below are some key figures in the calculations. The diagram above shows the Fossil CO2 Emissions Per Capita and the Free Level of emissions (green). The wide straight red line shows emissions in the 1990s (baseline in the calculations).

Climate Debt of Estonia 2025: $3.7 Billion or 0.04% of the Global Climate Debt (or $2694 Per Capita)
/2025/ Estonia ranks 24th in Climate Debt Per Capita accumulated 2000-2025. Below are some key figures in the calculations. The diagram above shows the Fossil CO2 Emissions Per Capita and the Free Level of emissions (green). The wide straight red line shows emissions in the 1990s (baseline in the calculations).
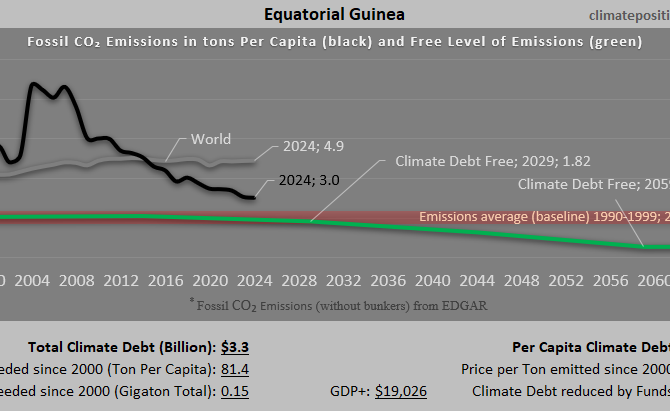
Climate Debt of Equatorial Guinea 2025: $3.3 Billion or 0.04% of the Global Climate Debt (or $1721 Per Capita)
/2025/ Equatorial Guinea ranks 36th in Climate Debt Per Capita accumulated 2000-2025. Below are some key figures in the calculations. The diagram above shows the Fossil CO2 Emissions Per Capita and the Free Level of emissions (green). The wide straight red line shows emissions in the 1990s (baseline in the calculations).
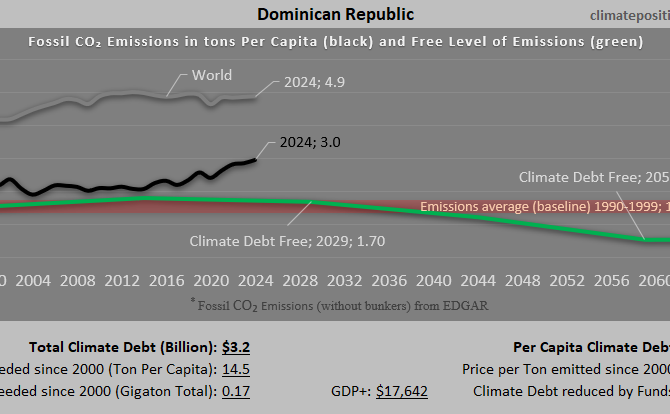
Climate Debt of Dominican Republic 2025: $3.2 Billion or 0.04% of the Global Climate Debt (or $284 Per Capita)
/2025/ Dominican Republic ranks 70th in Climate Debt Per Capita accumulated 2000-2025. Below are some key figures in the calculations. The diagram above shows the Fossil CO2 Emissions Per Capita and the Free Level of emissions (green). The wide straight red line shows emissions in the 1990s (baseline in the calculations).
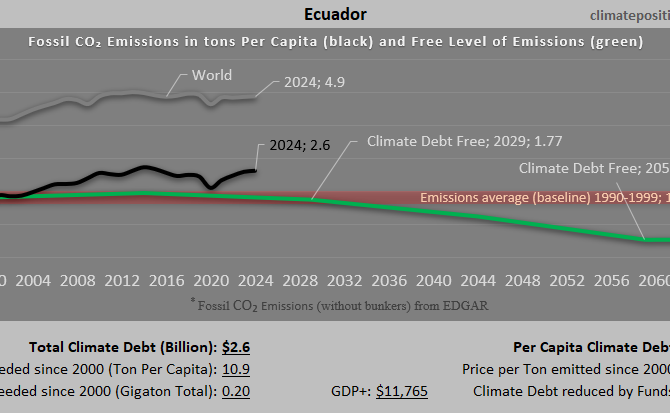
Climate Debt of Ecuador 2025: $2.6 Billion or 0.03% of the Global Climate Debt (or $143 Per Capita)
/2025/ Ecuador ranks 81st in Climate Debt Per Capita accumulated 2000-2025. Below are some key figures in the calculations. The diagram above shows the Fossil CO2 Emissions Per Capita and the Free Level of emissions (green). The wide straight red line shows emissions in the 1990s (baseline in the calculations).
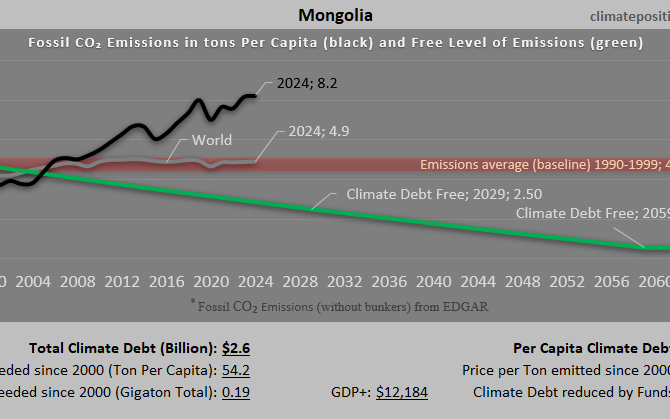
Climate Debt of Mongolia 2025: $2.6 Billion or 0.03% of the Global Climate Debt (or $734 Per Capita)
/2025/ Mongolia ranks 55th in Climate Debt Per Capita accumulated 2000-2025. Below are some key figures in the calculations. The diagram above shows the Fossil CO2 Emissions Per Capita and the Free Level of emissions (green). The wide straight red line shows emissions in the 1990s (baseline in the calculations).
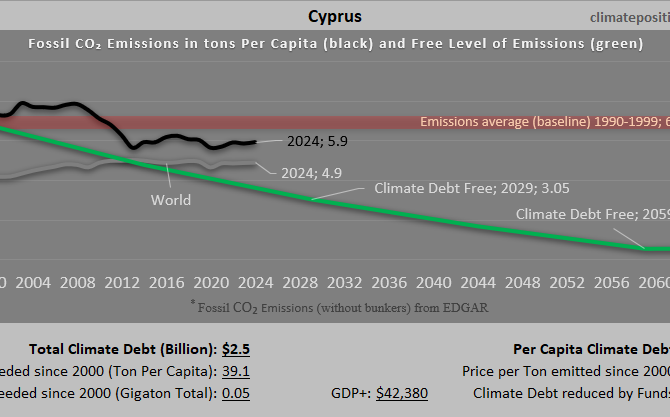
Climate Debt of Cyprus 2025: $2.5 Billion or 0.03% of the Global Climate Debt (or $1841 Per Capita)
/2025/ Cyprus ranks 33rd in Climate Debt Per Capita accumulated 2000-2025. Below are some key figures in the calculations. The diagram above shows the Fossil CO2 Emissions Per Capita and the Free Level of emissions (green). The wide straight red line shows emissions in the 1990s (baseline in the calculations).
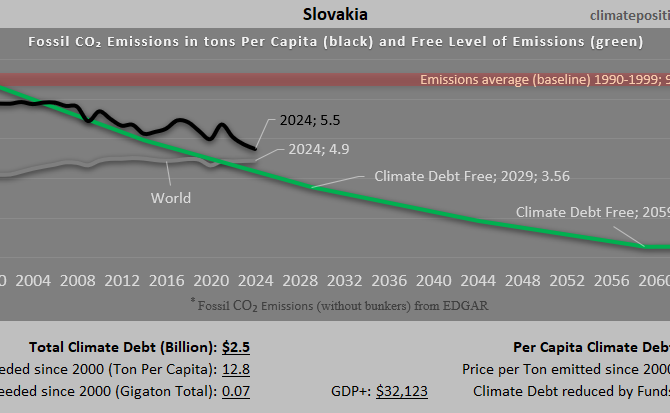
Climate Debt of Slovakia 2025: $2.5 Billion or 0.03% of the Global Climate Debt (or $457 Per Capita)
/2025/ Slovakia ranks 66th in Climate Debt Per Capita accumulated 2000-2025. Below are some key figures in the calculations. The diagram above shows the Fossil CO2 Emissions Per Capita and the Free Level of emissions (green). The wide straight red line shows emissions in the 1990s (baseline in the calculations).

Climate Debt of Iceland 2025: $2.4 Billion or 0.03% of the Global Climate Debt (or $5853 Per Capita)
/2025/ Iceland ranks 14th in Climate Debt Per Capita accumulated 2000-2025. Below are some key figures in the calculations. The diagram above shows the Fossil CO2 Emissions Per Capita and the Free Level of emissions (green). The wide straight red line shows emissions in the 1990s (baseline in the calculations).
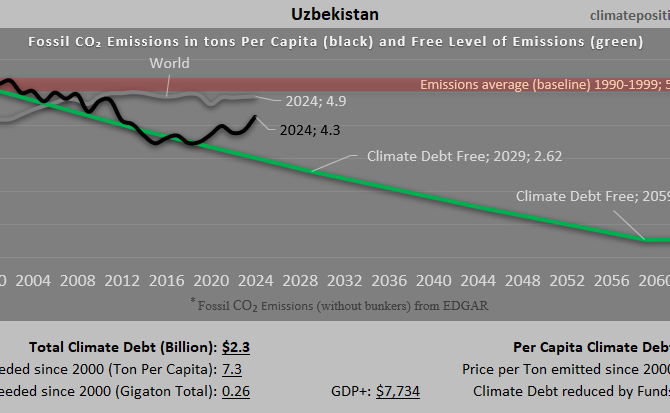
Climate Debt of Uzbekistan 2025: $2.3 Billion or 0.02% of the Global Climate Debt (or $62 Per Capita)
/2025/ Uzbekistan ranks 89th in Climate Debt Per Capita accumulated 2000-2025. Below are some key figures in the calculations. The diagram above shows the Fossil CO2 Emissions Per Capita and the Free Level of emissions (green). The wide straight red line shows emissions in the 1990s (baseline in the calculations).
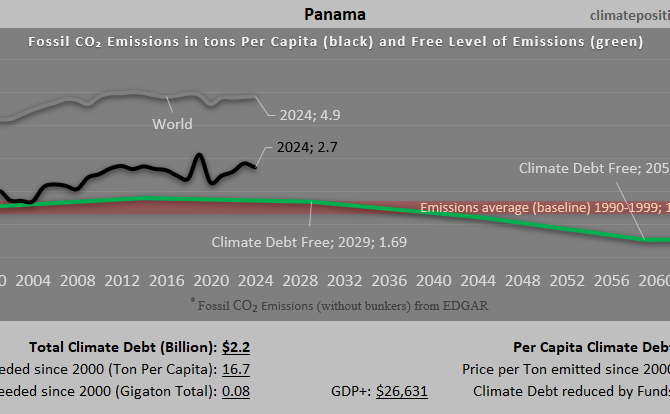
Climate Debt of Panama 2025: $2.2 Billion or 0.02% of the Global Climate Debt (or $494 Per Capita)
/2025/ Panama ranks 64th in Climate Debt Per Capita accumulated 2000-2025. Below are some key figures in the calculations. The diagram above shows the Fossil CO2 Emissions Per Capita and the Free Level of emissions (green). The wide straight red line shows emissions in the 1990s (baseline in the calculations).

Climate Debt of Tunisia 2025: $2.0 Billion or 0.02% of the Global Climate Debt (or $162 Per Capita)
/2025/ Tunisia ranks 79th in Climate Debt Per Capita accumulated 2000-2025. Below are some key figures in the calculations. The diagram above shows the Fossil CO2 Emissions Per Capita and the Free Level of emissions (green). The wide straight red line shows emissions in the 1990s (baseline in the calculations).
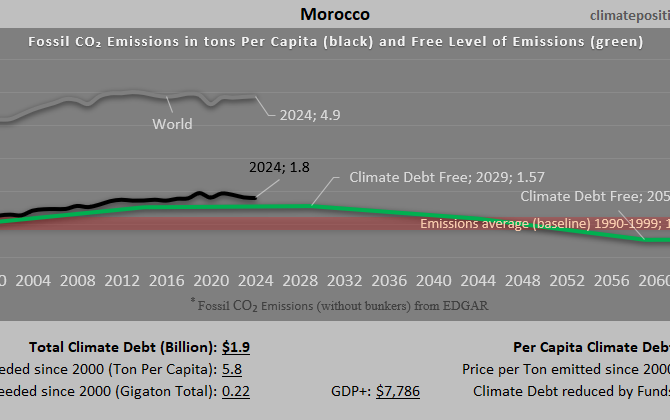
Climate Debt of Morocco 2025: $1.9 Billion or 0.02% of the Global Climate Debt (or $50 Per Capita)
/2025/ Morocco ranks 90th in Climate Debt Per Capita accumulated 2000-2025. Below are some key figures in the calculations. The diagram above shows the Fossil CO2 Emissions Per Capita and the Free Level of emissions (green). The wide straight red line shows emissions in the 1990s (baseline in the calculations).

Climate Debt of Lebanon 2025: $1.6 Billion or 0.02% of the Global Climate Debt (or $274 Per Capita)
/2025/ Lebanon ranks 71st in Climate Debt Per Capita accumulated 2000-2025. Below are some key figures in the calculations. The diagram above shows the Fossil CO2 Emissions Per Capita and the Free Level of emissions (green). The wide straight red line shows emissions in the 1990s (baseline in the calculations).
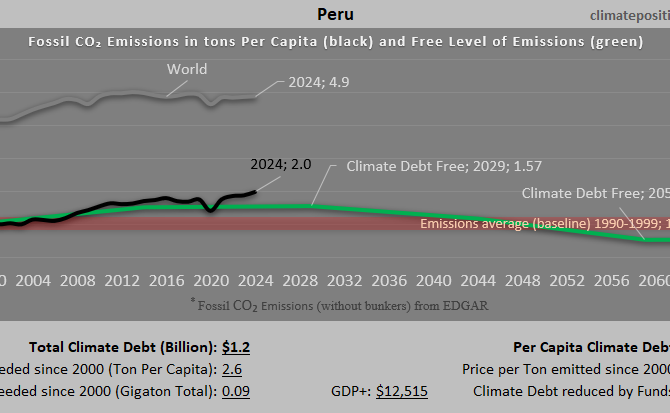
Climate Debt of Peru 2025: $1.2 Billion or 0.013% of the Global Climate Debt (or $36 Per Capita)
/2025/ Peru ranks 93rd in Climate Debt Per Capita accumulated 2000-2025. Below are some key figures in the calculations. The diagram above shows the Fossil CO2 Emissions Per Capita and the Free Level of emissions (green). The wide straight red line shows emissions in the 1990s (baseline in the calculations).
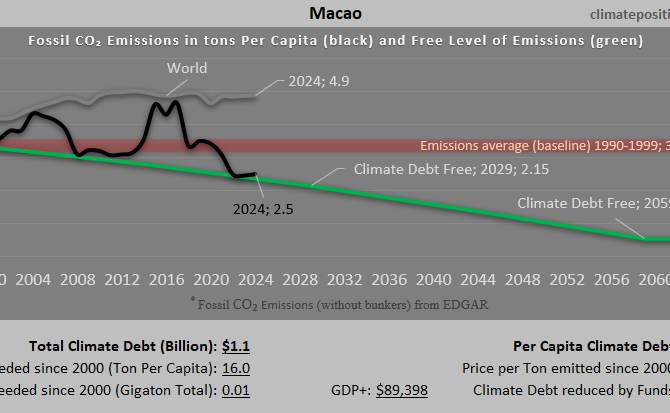
Climate Debt of Macao 2025: $1.1 Billion or 0.012% of the Global Climate Debt (or $1593 Per Capita)
/2025/ Macao ranks 38th in Climate Debt Per Capita accumulated 2000-2025. Below are some key figures in the calculations. The diagram above shows the Fossil CO2 Emissions Per Capita and the Free Level of emissions (green). The wide straight red line shows emissions in the 1990s (baseline in the calculations).

Climate Debt of Mauritius 2025: $917 Million or 0.01% of the Global Climate Debt (or $728 Per Capita)
/2025/ Mauritius ranks 57th in Climate Debt Per Capita accumulated 2000-2025. Below are some key figures in the calculations. The diagram above shows the Fossil CO2 Emissions Per Capita and the Free Level of emissions (green). The wide straight red line shows emissions in the 1990s (baseline in the calculations).
