Polynomial projections of global warming 1880-2014 … 2130
2015
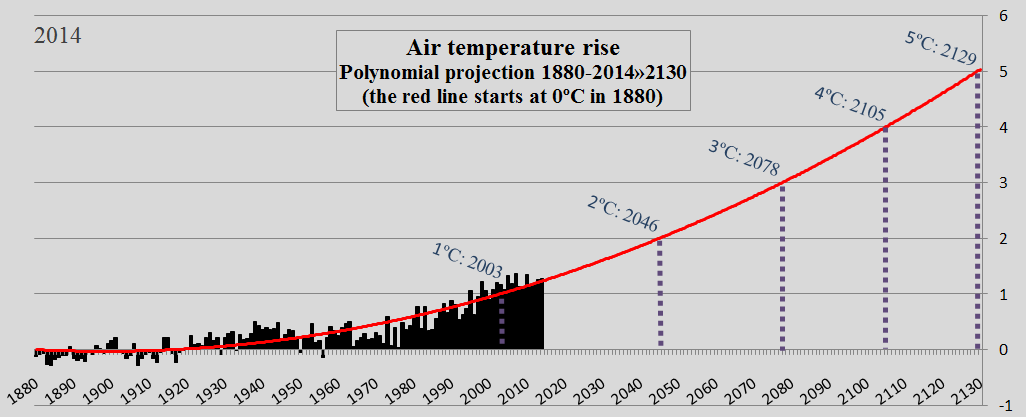
The global Land (air) Temperature of 2014 was the 4th warmest ever measured. Both the global Ocean (air) Temperature and the combined Ocean and Land Temperature of 2014 were the warmest ever measured (see ‘here‘).
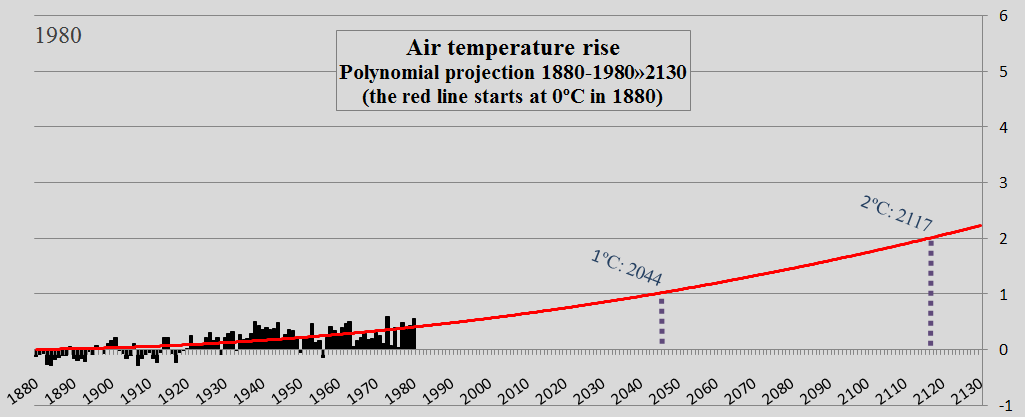
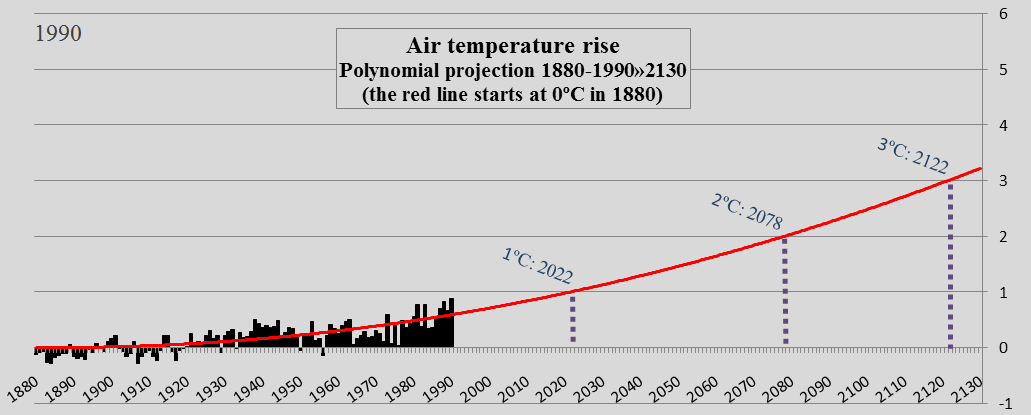
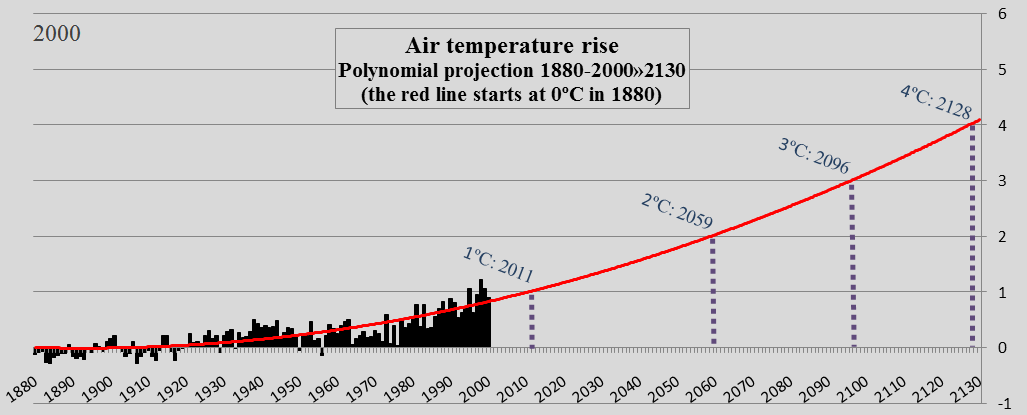
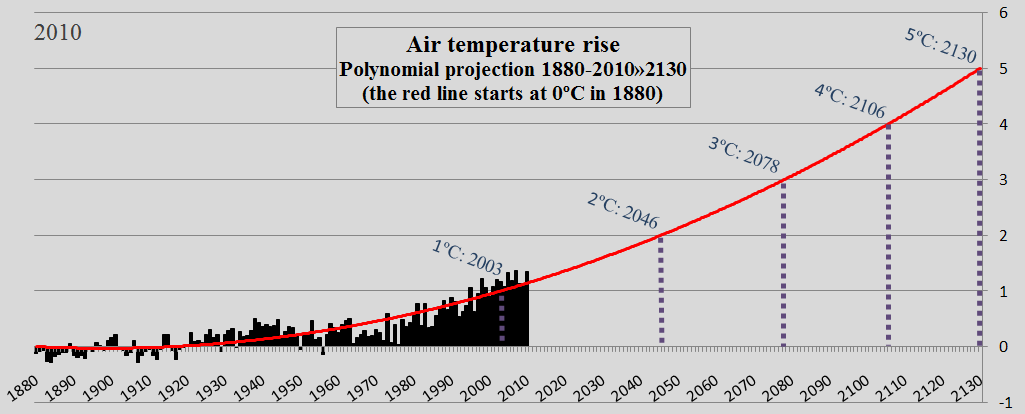
A ‘polynomial projection’ (or polynomial interpolation) of temperature is neither a prediction nor a scientific scenario with certain assumptions. A polynomial projection reproduces data into the future in a sounder manner than a linear projection. The five diagrams below show the global Land (air) Temperature since 1880 with polynomial projections from 1980, 1990, 2000, 2010 and 2014 … projected by 2130. The red projection line start at 0°C in 1880 and the passing-years of 1°C, 2°C, 3°C etc. are marked. Read the comments below the diagrams.
See the projections 1980-2010 in pdf ‘here’.
The main drive of the global warming is carbon dioxide emissions from the burning of fossil fuels – since 1980 these emissions have increased by 78%. Other human caused greenhouse gas emissions and activities1 add to the warming effect. However, the dangerous feedback effects2 triggered by the anthropological global warming seem to accelerate the greenhouse effect as predicted back in the 1950s and 1960s. Read the articles ‘Early history of global warming science and predictions’ and ‘Global warming and IPCC worst case scenarios 1990 and 2014’.
The polynomial projection lines pass 2°C warming as follows:
- 1880-1980: 2117
- 1880-1990: 2078
- 1880-2000: 2059
- 1880-2010: 2046
- 1880-2014: 2046 (or 2045)
The two largest economies and CO2 emitters the ‘United States‘ and ‘China‘ (responsible of 22% and 15% of the global CO2 Emissions from fossil fuels since 1980) have persistently rejected a globally binding greenhouse gas reduction agreement and now a 2°C rise in temperature is considered practically unavoidable.
1 Increased greenhouse effect from human activities such as cement production, deforestation, livestock, agriculture, enteric fermentation, landfills etc.
2 Feedback effects (loops) of melting and darkening ice caps (reflecting less sun heat), melting permafrost releasing methane, more water vapor from warmer oceans, weakened rainforests, coral reefs and other ecosystems (absorbing less carbon dioxide), increasing methane leaks from warmed up wetlands, landfills etc.
A hypothetically example: If the United States and China paid their climate debt (accumulated since 2000) of respectively $1,936 billion and $540 billion to a Global Climate Fund, then 67 Contribution Free countries with 65% of the global population would benefit from financial support of a total of $2,476 billion to climate- and environmental projects. If all 82 countries paid their climate debt, then the total amount would be $5,226 billion (see the ‘ranking’).
Data sources on global Air Temperature: NOAA National Climatic Data Center (links in the menu “Calculations”).
Source on CO2 Emissions: EIA, U.S. Energy Information Administration and data on preliminary national CO2 Emissions are from Global Carbon Project (links in the menu “Calculations”).
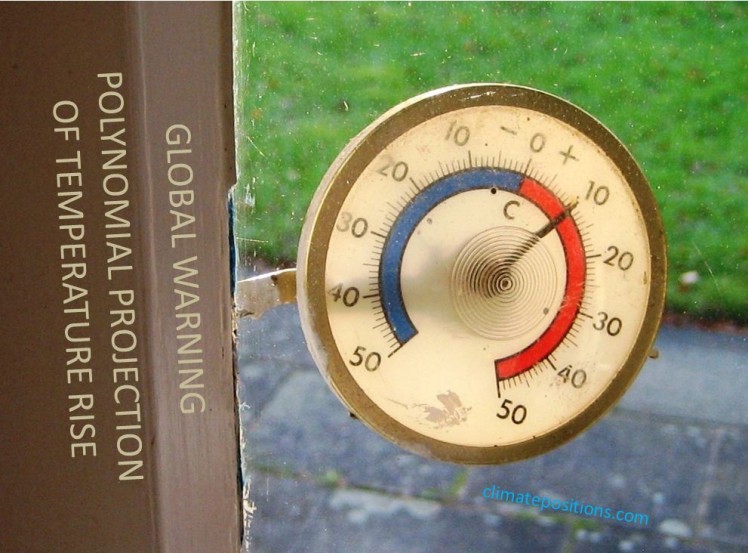
Top photo (with text) by Claus Andersen, 2015.
Comments are closed.