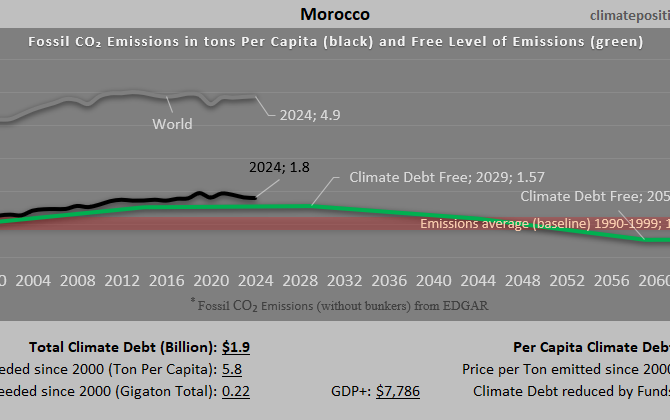
Climate Debt of Morocco 2025: $1.9 Billion or 0.02% of the Global Climate Debt (or $50 Per Capita)
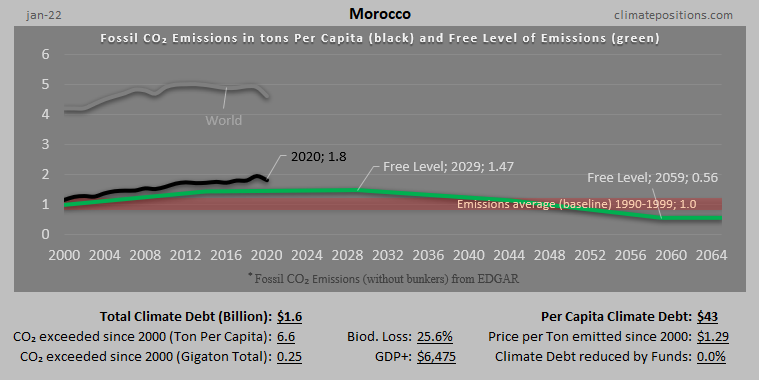
/2025/ Morocco ranks 90th in Climate Debt Per Capita accumulated 2000-2025. Below are some key figures in the calculations. The diagram above shows the Fossil CO2 Emissions Per Capita and the Free Level of emissions (green). The wide straight red line shows emissions in the 1990s (baseline in the calculations).
Algeria – per capita Fossil CO2 Emissions and Climate Debt
2020
Algeria’s current Climate Breakdown Pricing amounts to $5.56 per tons Fossil CO2 emitted since 2000. The Climate Debt grew from $150 per capita in 2015 to $346 in 2020. Updated Rankings of 165 countries are available in the menu “Climate Debt”.
The following diagrams expose the trends of Fossil CO2 Emissions, Climate Debt, GDP(ppp-$) and Ecological Footprint without carbon.
Spain – per capita Fossil CO2 Emissions and Climate Debt
2020
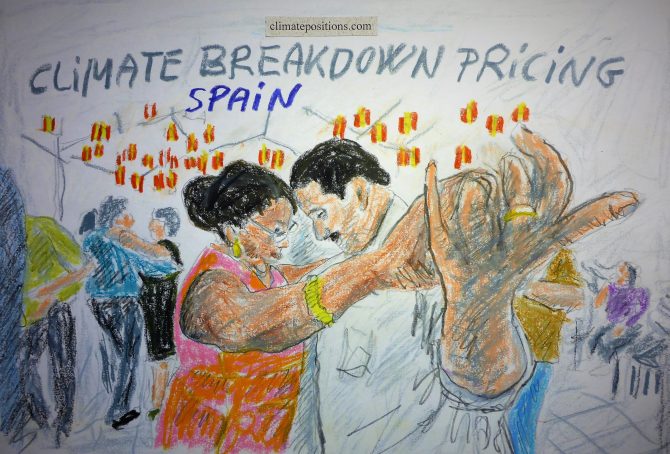
Spain’s current Climate Breakdown Pricing amounts to $16.05 per tons Fossil CO2 emitted since 2000. The Climate Debt grew from $1,173 per capita in 2015 to $2,110 in 2020. Updated Rankings of 165 countries are available in the menu “Climate Debt”.
The following diagrams expose the trends of Fossil CO2 Emissions, Climate Debt, GDP(ppp-$) and Ecological Footprint without carbon.
India – per capita Fossil CO2 Emissions (zero Climate Debt)
2020
In the calculation of Climate Debt, India is especially interesting because it has zero Climate Debt despite the fact that the country is the 3rd largest emitter of Fossil CO2. As it appears, India will enter the next 20-year period in ClimatePositions (2020-2039) without any Fossil CO2 Emissions exceeded. The final calculation will be made, when data on Fossil CO2 Emissions 2019 are released.
The following diagrams expose the trends of Fossil CO2 Emissions, GDP(ppp-$), Ecological Footprint without carbon, Forest Cover and Primary Forest.
India’s Climate Debt is on track for something big
2016
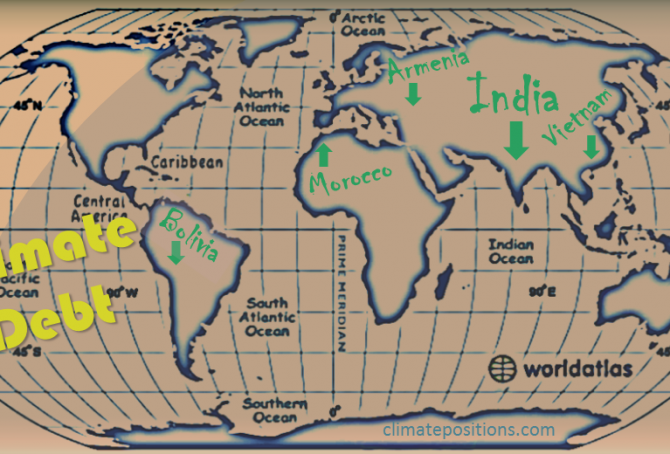
India’s accumulated Climate Debt is $13 per capita which ranks the populous country 84th among 148 countries (see the ‘Ranking’). The current share of the fast growing global Climate Debt is 0.29%, compared to 0.04% in 2010. The following examines India’s CO2 Emissions (the increase-rates is compared to the historic Chinese rates), Environmental Performance, GDP(ppp-$) and Climate Debt in comparison with Vietnam, Morocco, Armenia and Bolivia, all ranked between 77th and 82nd.
Climate change performance of Libya, Algeria, Tunisia and Morocco (refugees and the European Union)
2015
A devilish combination of poverty, armed conflict and violence in parts of Africa and Middle East, sends flows of refugees in boats across the Mediterranean Sea to Europe via Spain, Italy, Malta and Greece. In 2014 around 150,000 survived the dangerous trip to Italy alone. However, the European Union (EU) offers (as it seems) only a total of 5,000 resettlement places across Europe and the vast majority of all refugees will be sent back as irregular migrants. Read this ‘article’ from The Guardian.
Climate Change Performance Index 2013
2013
‘Climate Change Performance Index 2013’ is a ranking of 58 countries that was published recently by ‘Germanwatch’ and ‘Climate Action Network Europe’ – with the help of over 230 experts worldwide. 80% of the evaluation is based on indicators of emissions (30% for emissions levels and 30% for recent development of emissions), efficiency (5% level of efficiency and 5% recent development in efficiency) and renewable energy (8% recent development and 2% share of total primary energy supply). For the first time emissions from deforestation is included. The remaining 20% of the evaluation is based on national and international climate policy assessments by experts from the respective countries.
