The United Kingdom beats Germany in climate change performance
2014
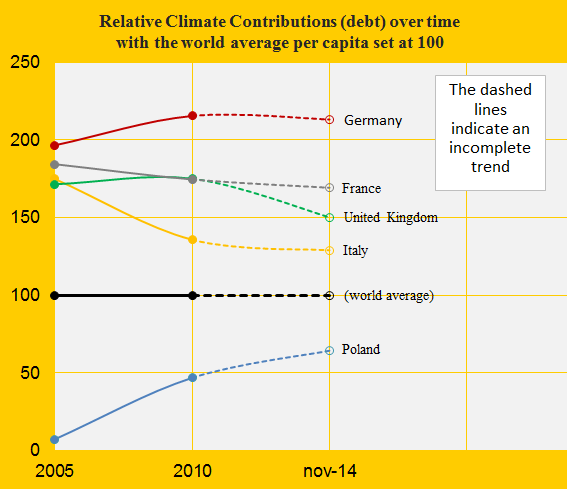
Germany is ranked 24th and United Kingdom 33rd among 147 countries on the list of the worst performing countries in ClimatePositions. See the ‘ranking’. The German Climate Contribution (debt) accumulated since 2000 has increased from $980 per capita in 2010 to $1,640 in the latest calculation, while the one of the United Kingdom has increased from $796 to $1,156. The first diagram shows the relative climate debt of the two countries in comparison with France, Italy and Poland, with the world average set at 100. Since 2010, the United Kingdom is the only country among the five that has improved significantly. The world average climate debt has increased from $455 per capita in 2010 to $769 in the latest calculation (this increase reflects both the growing CO2 Emissions from fossil fuels and the growing economy). The following analyses some trends for Germany and the United Kingdom.
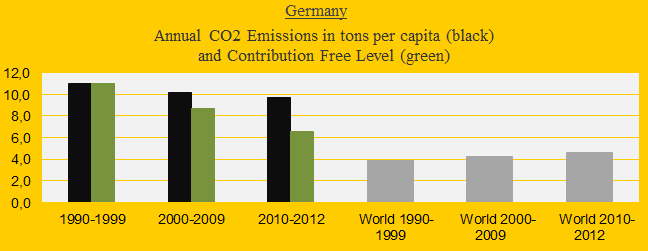
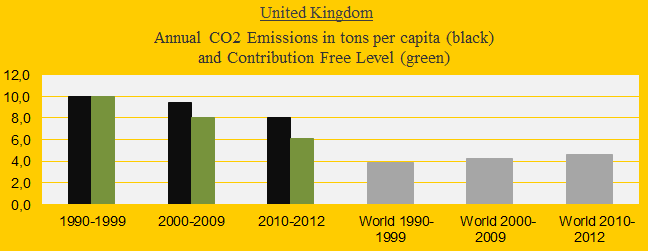
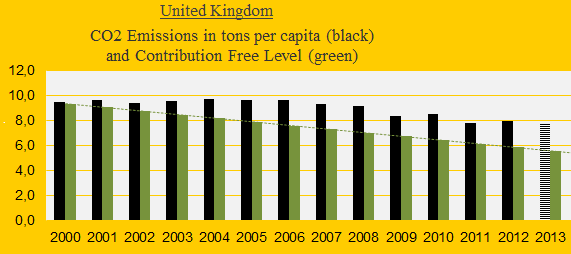
The two diagrams below show Germany’s and United Kingdom’s CO2 Emissions per capita in decades. The green bars show the Contribution Free Level and the grey bars are the world average. The German gab between the actual emissions and the Contribution Free Level is growing faster than the one of the United Kingdom.
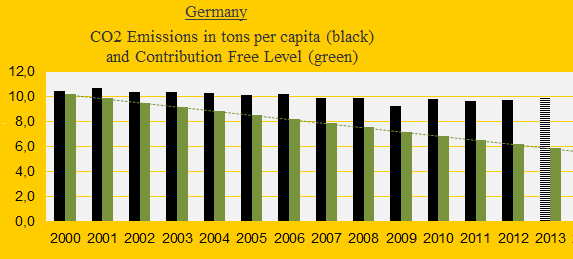
CO2 Emissions per capita annually since 2000 are shown in the diagrams below. United Kingdom’s reductions since 2006 are significant while Germany’s are negligible (note that 2013-emissions are preliminary estimates).
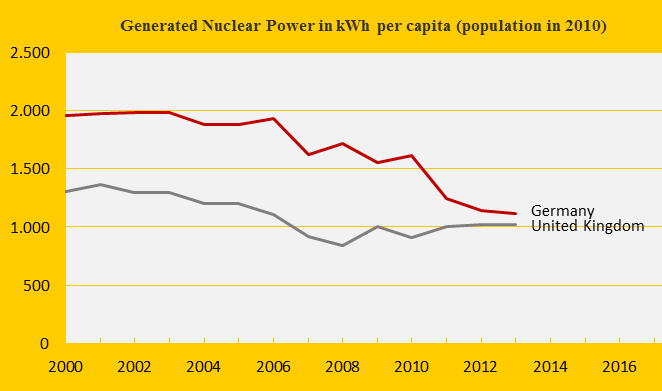
The Nuclear Power generation per capita of the two countries has decreased since 2000 (see below). However, United Kingdom has increased the generation marginally again after 2008. In ClimatePositions Nuclear Power is not accepted as a national CO2 Emission reduction instrument due to the dangerous radioactive waste (read ‘more‘).
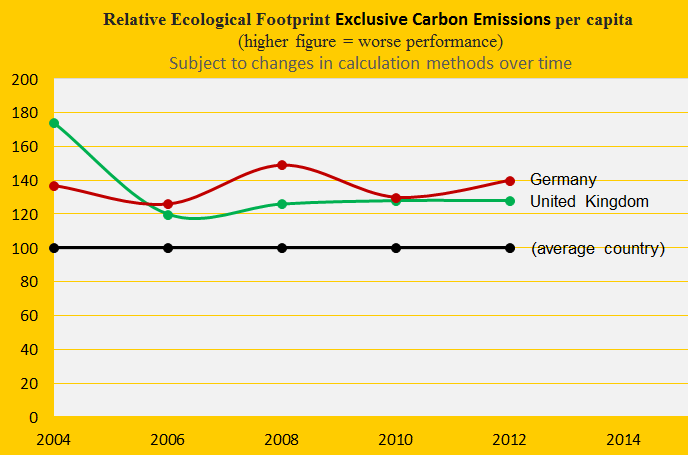
The Ecological Footprints without carbon emissions per capita of Germany and the United Kingdom are larger than an average country (set at 100 in the diagram below). Note that 1.5 earths are required today to meet the human demands on nature (read ‘more’).
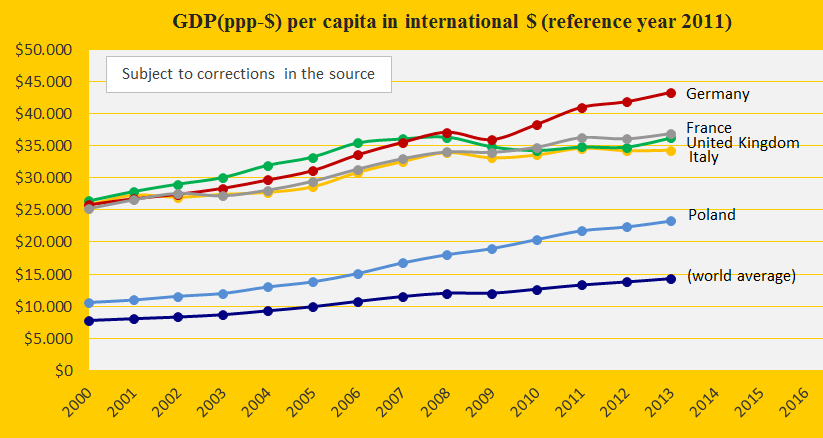
The next diagram shows the GDP(ppp-$) per capita of Germany, United Kingdom, France, Italy, Poland and the world average. Germany passed the United Kingdom in wealth in 2007, just before the financial crisis.
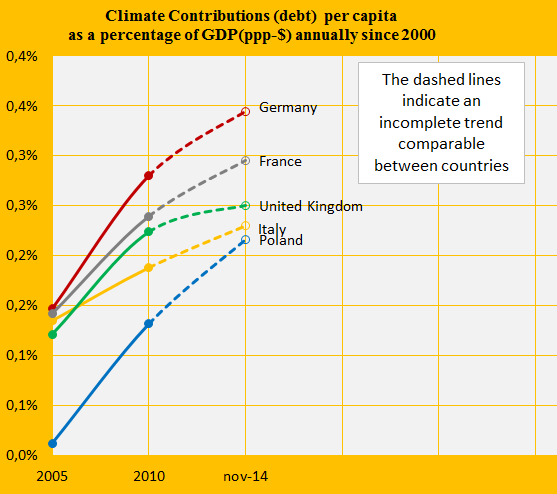
The last diagram (below) shows the accumulated Climate Contributions (debt) as percentages of the GDP(ppp-$) annually since 2000. Only the United Kingdom performs a deflected growth rate since 2010 among these five European countries.
.
A hypnological example: If Germany had reduced the CO2 Emissions since 2006 at the same rate as the United Kingdom, then the accumulated climate debt would have been $1,308 per capita instead of $1,640 (20% savings).
Source on CO2 Emissions: EIA, U.S. Energy Information Administration and data on preliminary national CO2 Emissions are from Global Carbon Project (links in the menu “Calculations”).
Information on national GDP(ppp-$) per capita: Worldbank (links in the menu “Calculations”).
Source on Ecological Footprint: WWF reports “The Living Planet” published 2006-2014 (links in the menu “Calculations”).
Comments are closed.