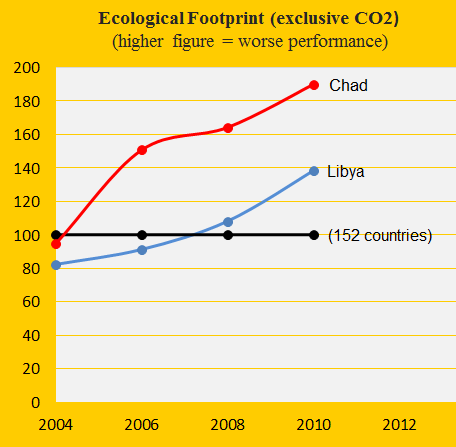
Climate performance: Libya versus Chad
2014
Libya was the 29th worst performing country out of 145 in ClimatePositions 2010 and thus the worst performing country in Africa (read more ‘here’). The authoritarian oil-regime’s Climate Contribution (climate debt) has increased to $819 per capita in the updated calculation. Chad is Contribution Free in spite of a surprisingly large Ecological Footprint (excluding CO2 Emissions) – see the diagram. The large footprint is partly due to large herds of commercial cattle, goats, sheep, horses and donkeys. The following examines the indicators: CO2 Emissions, GDP(ppp-$) and the Climate Contributions over time.
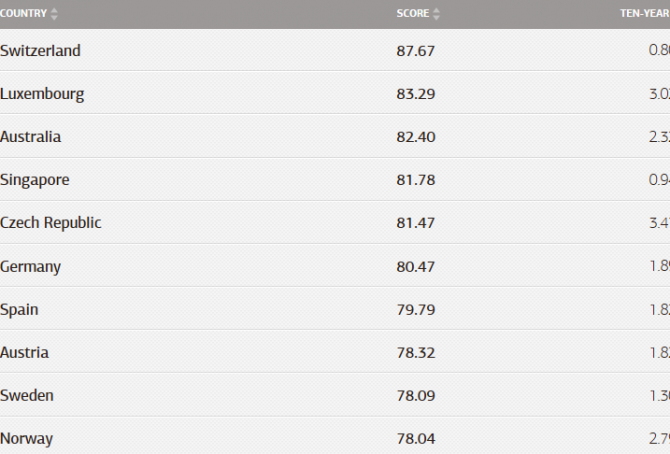
Environmental Performance Index 2014: Rankings of 178 countries
2014
Every second year Yale and Colombia Universities, in collaboration with the World Economic Forum, publish an Environmental Performance Index (EPI) with global rankings. The 2014 edition with rankings of 178 countries is now available ‘here’. The top ten countries are shown in the diagram. The Index ranks how well the countries perform on 1) Health Impacts (Air Quality, Water and Sanitation) and 2) Ecosystem Vitality (Water Resources, Agriculture, Forests, Fisheries, Biodiversity and Habitat, Climate and Energy). Underlying the nine issue categories are 20 indicators calculated from country-level data and statistics. Scores are converted to a scale of 0 to 100, with 0 being the worst observed value and 100 the best.
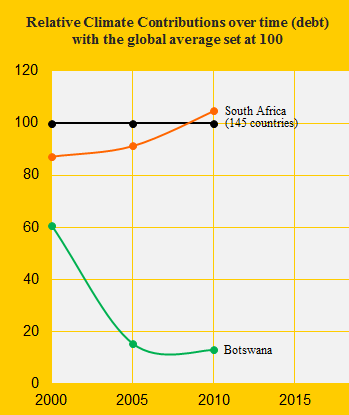
Climate performance: South Africa versus Botswana
2014
South Africa was the 38th worst performing country out of 145 in ClimatePositions 2010 while the neighboring Botswana was the 60th. The Climate Contributions (climate debt) were respectively $448 and $69 per capita (with the latest updates the amounts have increased to $592 and $84 per capita). See the relative Contributions in 2000, 2005 and 2010 in the diagram with the global average set at 100. Below we highlight some of the national indicators in the calculations.