
Global losses due to climate change
2014
Manmade climate change leads to increased frequency, intensity and duration of extreme weather events. The global losses due to climate change are of course impossible to quantify but the losses accumulated by global reinsurance companies¹ may provide a clue of the seriousness of the situation. The two diagrams below show statistics of ‘Swiss Re’ (see this ‘release’) and ‘Munich Re’ (from The World Bank Report ‘Building Resilience’). The overall picture is similar: Global losses due to extreme weather events have increased dramatically since the 1980s and are now around $150-200 billion annually.
Early history of global warming science and predictions
2014
Here are some highlights of the early history of climate change science and predictions from 300 BC until the release of the First Intergovernmental Panel on Climate Change (IPCC) Assessment Report in 1990:
300 BC
The Greek philosopher ‘Theophrastus’ (a student of Aristotle) documented that human activity affects the climate. He observed that drainage of marshes cooled an area around Thessaly and that clearing of forests near Philippi warmed the climate. See this publication from 1894: “On Winds and on Weather Signs” (translated, with an introduction and notes).
1824-1827
The French mathematician and physicist ‘Jean Baptiste Joseph Fourier’ (1768-1830) found that the atmosphere kept the planet warmer and he made calculations of the warming effect. He suspected that human activities could influence the climate, although he focused on land use changes. Fourier’s findings are widely recognized as the first proposal of what today is known as the greenhouse effect. Read more ‘here‘.
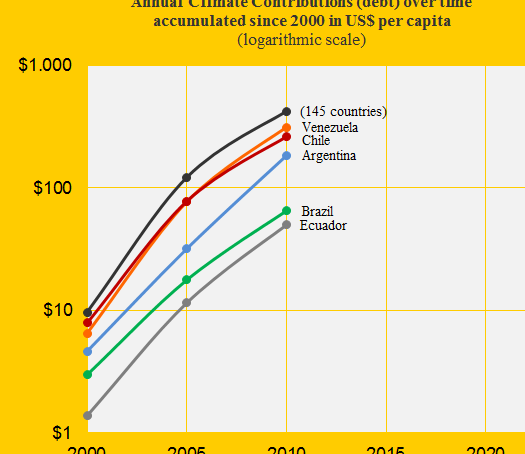
Venezuela loses big to Colombia in climate responsibility
2014
Colombia was Contribution Free in ClimatePositions 2010 and Venezuela was the 43rd worst performing country out of 145 (see the menu “Contributions”). The Venezuelan Climate Contribution (climate debt) was $313 per capita which was the 3rd largest in America after the extreme polluters United States and Canada. The diagram shows the Climate Contributions over time per capita of Venezuela, Chile, Argentina, Brazil, Ecuador and the world average (145 countries). In the updated calculation Venezuela’s Contribution has increased to $428 per capita (worsened two country rankings). The following examines Colombia’s and Venezuela’s CO2 Emissions, Ecological Footprint, Environmental Performance and forest cover.

Climate performance of Israel, Occupied Palestinian Territories and neighboring countries
2014
Israel was the 16th worst performing country out of 145 in ClimatePositions 2010 with a Climate Contribution of $1,790 per capita (see the ranking in the menu “Calculation”). The Palestinian Territories (Gaza Strip and West Bank, both occupied by Israel) were in reality Contribution Free (though excluded from the inventory due to lack of indicator data¹). The following examines the statistics of Israel, the Occupied Palestinian Territories, Lebanon, Jordan, Syria and Egypt.
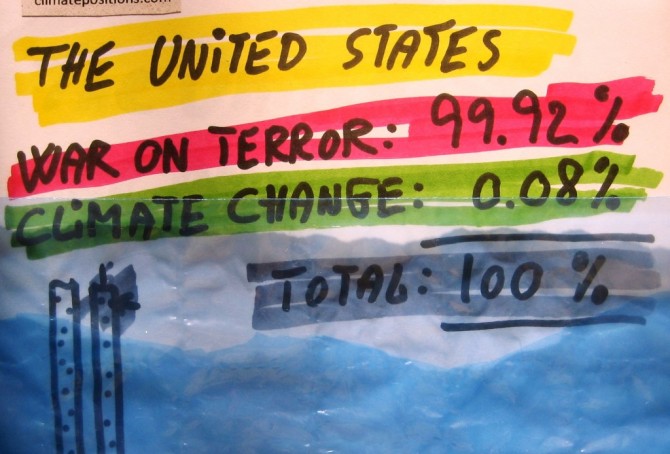
The United States’ war on terror and climate change
2014
Since dawn the United States has thwarted a binding global climate agreement – if necessary by the use of illegal spying on countries with opposing plans. The U.S. negotiating line is now the main track at the COP Summits and the rest is sadness. Now, U.S. Secretary of State John Kerry says that climate change ranks among the world’s most serious problems, such as disease outbreaks, poverty, terrorism and the proliferation of weapons of mass destruction (more about his speech ‘here’). But how much money has the United States spent on the so called “war on terror”? … And how much addressing the climate change disaster?
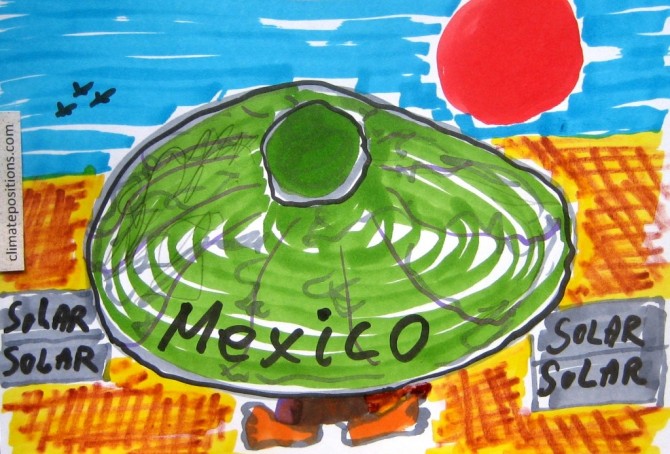
Climate performance of Mexico and neighboring countries
2014
The Mexican CO2 Emissions per capita over time are similar to the world trend (see the diagram) and Mexico is the world’s 12th largest CO2 emitter. Together with the neighboring countries Mexico represent the full range of Climate Contributions (climate debt) worldwide. The following examines the statistics of Mexico in comparison with United States, Guatemala, El Salvador and Honduras.

Climate performance of India, Pakistan and Bangladesh
2014
India, Pakistan and Bangladesh are all Contribution Free in ClimatePositions. With 23% of the world population, and 54% of the Contribution Free population, the three populous countries are natural candidates of climate change compensation. Bangladesh is considered one of the most vulnerable to climate change – where millions are expected to be displaced due to flooding. A Global Climate Fund could lead aid efforts, but this idea seems to be “stone dead” since the major of atmosphere-poisoning countries refuse to finance the damages they cause (see the country list in the menu “Contributions”). However, India has to be cautious of its own climate performance in the coming years.

Outsourcing of CO2 Emissions from the United States to China
2014
If the United States reduced the CO2 Emissions produced inside its borders and the dirty productions as a competitive consequence moved to China (or elsewhere), the positive impact on the climate would vanish. This obvious dilemma can only be solved if both countries sign a binding climate agreement with solid and fair CO2 Emission targets – which the two countries reject (read more on their COP positions ‘here’). The position of the United States is particularly perverted: 1) Reduction-targets of national CO2 Emissions must be voluntary and 2) Investments in climate actions must be profitable. The bizarre U.S. vision is to create a new global commercial market for voluntary climate investments, a commercial market with parallels to the United States, the homeland of the climate chaos.