Carbon dioxide emissions 2013 – China, the United States, India and Russia
2014
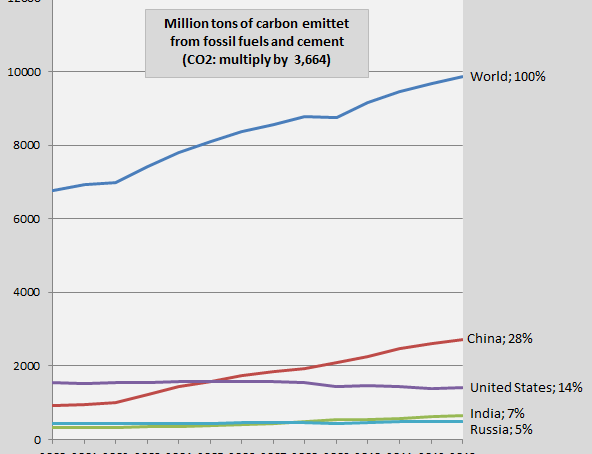
The diagram shows the global development of carbon dioxide emissions from fossil fuels and cement 2000-2013 (measured by pure carbon) and of the four largest emitters China, the United States, India and Russia. The 2013-emissions are preliminary with an enlarged uncertainty of ±5%. The national shares of the global emissions in 2013 are shown in percent to the right. The four countries accounted for 54% of the global emissions in 2013 (48% in 2000). The preliminary carbon dioxide emissions in 2013 of 216 countries is available ‘here’¹. Global emissions are on track of the worst out of four scenarios, likely heading for 3.2-5.4°C increase in temperature by 2100, since pre-industrial era (see the diagram below from ‘Global Carbon Project’, and ‘presentation (pdf)‘.
Carbon cycle for beginners
2014
Carbon is one out of 118 known chemical elements and symbolized with a “C” (as in CO2). Carbon is globally spread and essential for all life (18.5% of the human body mass is carbon). However, only around 0.003% of the carbon on earth is within living organisms and possibly the double occur in ancient organic deposits of coal, oil, gas and peat. Pure carbon can be chemically composed several ways, for example in the form of diamond, graphite, graphene or simply as amorphous carbon. See this short instructive video: ‘Carbon – Periodic Table of Videos (10:02)’. Carbon forms almost ten million known compounds with other chemical components, which is more than any other chemical element. Carbon dioxide (or CO2) is one compound, composed of one atom of carbon (C) and two atoms of oxygen (O2). Methane (or CH4) is another, composed of one atom of carbon and four atoms of hydrogen.

Invasive species, climate change and mass extinction
2014
There is a lack of standard terminology for invasive species. Some used definitions¹ seem artificially twisted so that Homo sapiens can’t be classified as an invasive species (which of cause is absurd since we are the worst). My own definition used in this article is this: “Invasive species are animals and plants introduced into places out of their natural range of distribution, where they have a tendency to spread and generate a negative impact on the local ecosystem and species.” This clarifies three disputes: a) A species can be invasive and not invasive at different times and different places, b) consequently, not all Homo sapiens are necessarily invasive, and certainly not all the time and c) transportation by plane, ship, train, vehicle, etc. often carry animals (including Homo sapiens) and plants further than their natural range of distribution. This opens up for analyzes.
Forest Cover, Primary Forests and climate debt
2014
The national data of Forest Cover and Primary Forest are both included in the calculations of Climate Contributions (debt) in ClimatePositions. Primary Forest was included as an indicator in the worksheet in August 2014. The following describes selected findings on forests from FAO’s ‘The Global Forest Resources Assessments (FRA), 2010’ (main report, pdf, 378 pages). The Assessment is based on two primary sources of data: 1) ‘country reports’ and 2) remote sensing conducted by FAO and partners.