Renewable energy and Climate Debt by country
2015
Between 2000 and 2012 the global consumption of ‘Primary Energy’ increased by 32%, the global CO2 Emissions from the burning of fossil fuels increased by 34% and the world’s population grew by 15%. These figures should be seen in the context of the historic increases of ‘atmospheric concentration of greenhouse gases’ and the resulting ‘temperature rise’. The heartbreakingly imprudent and brutal development is reflected in 82 countries’ current Climate Debt in ClimatePositions. Many countries wisely prioritize ‘renewable energy’, however, globally renewable energy¹ (electrically generated) was only 8.6% of the total primary energy production in 2012 compared to 7.4% in 2000.
The table below ranks the 82 countries with Climate Debt by:
- Climate Debt per capita in 2013 (worst performing first).
- CO2 Emissions from fossil fuels in tons per capita in 2012.
- Renewable energy production (electrically generated) as share of the total primary energy production in 2012.
- Increase of the share of renewable energy production from 2000 to 2012.
IEA estimate: No reduction of global CO2 Emissions in 2014
2015
Preliminary data from the ‘International Energy Agency (IEA)‘ suggest no reduction of global CO2 Emissions from fossil fuels in 2014 compared to 2013. Global emissions were 31.7 Billion tons in 2012 and 32.3 Billion tons in 2013 as well as in 2014 (preliminary estimate). The diagram below copied from ‘IEA Key World Energy Statistics 2014’ show the global emissions from 1971 to 2012. According to IEA 2014 was the first year in four decades with growing global economy (by 3%) without a corresponding increase of CO2 Emissions from fossil fuels. Or as IEA puts it: “for the first time, greenhouse gas emissions are decoupling from economic growth.” Since the world population is growing around 1% annually the CO2 Emissions per capita has decreased by about 1% in 2014 compared to 2013 (preliminary estimate). This good news must, however, be put into perspective before applause breaks out – read below the diagram.
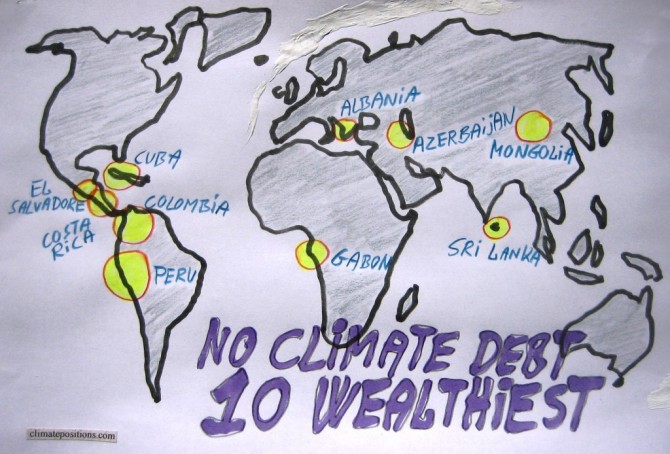
The ten wealthiest countries without any Climate Debt
2015
Among the 147 countries with full data in ClimatePositions 65 are Contribution Free (no Climate Debt). See the ‘ranking’. The table in this article ranks (from 1 to 10) the ten wealthiest Contribution Free countries by the following eight indicators:
- Per capita GDP(ppp-$) (1 = wealthiest)
- Income Equality (1 = most equal)
- Per capita CO2 Emissions from fossil fuels (1 = lowest emissions)
- Democracy Index (1 = most democracy)
- Environmental Performance (1 = best performance)
- Life Expectancy by birth (1 = longest lives)
- Per capita Ecological Footprint without carbon (1 = smallest footprint)
- Primary Forests as a percentage of the total land area (1 = largest percentage)
Read the comments below the table.
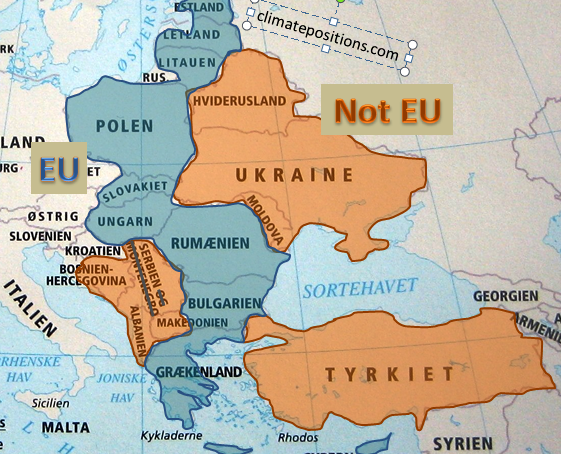
European Union “east” compared to bordering countries
2015
The ‘European Union’ (EU) is an economic and political partnership between ‘28 countries’. Around 7% of the global population lives in EU and they emit around 12% of the global CO2 from fossil fuels and are responsible of 13% of the Climate Debt in ClimatePositions. The following examines a group of 10 countries in eastern EU which joined the union between 1981 and 2007 in comparison with 8 bordering countries.

Climate change performance: Turkey vs. Egypt
2015
Turkey is ranked 57th and Egypt 71st among 147 countries on the list of the worst performing countries in ClimatePositions. See the ‘ranking’. The Turkish Climate Debt accumulated since 2000 increased from $161 per capita in 2010 to $324 in the latest calculation, while the one of Egypt increased from $40 to $73. The first diagram shows the relative Climate Debt of the two countries in comparison with Lebanon, Jordan and China, with the world average set at 100. Note that the world’s average Climate Debt increased from $455 per capita in 2010 to $769 in 2014 (reflecting the growing CO2 Emissions from fossil fuels and the growing economy). The following examines some indicators and trends of Turkey and Egypt.
Climate change performance of Norway (and the giant oil fund)
2015
Norway’s first oil field started production in 1971 and since 1996 petroleum revenue has been transferred to what’s now called the ‘Government Pension Fund Global’ – often referred to as Norway’s Oil Fund. Today, the fund’s market value is around $884 Billion. For comparison, the updated Norwegian Climate Contribution in ClimatePositions is $16.4 Billion and the climate financing¹ $1.5 Billion. Below are listed some perspectival per capita figures:
- The current market value of Norway’s Oil Fund is around $188,000 per capita (per Norwegian). In 2000 the market value was $11,000 per capita.
- The accumulated Climate Contribution in ClimatePositions is $3,490 per capita.
- The climate financing is $321 per capita (9% of the Climate Contribution which is world record; read this ‘article‘).
- The updated Climate Debt is $3,169 per capita which ranks Norway 15th in the world (see the ‘ranking’).
- The oil production per capita was 6th in the world in 2013, after Qatar, Kuwait, United Arab Emirates, Saudi Arabia and Equatorial Guinea – in 2000 Norway was 2nd. Norway’s oil production decreased by 46% between 2000 and 2013 … the world production increased by 17% during the same period.
- The natural gas production per capita was 4th in the world in 2012, after Qatar, Trinidad and Tobago and Brunei. Norway’s natural gas production increased by 106% between 2000 and 2012 … the world production increased by 37% during the same period.
The following examines Norway’s CO2 Emissions, Climate Debt over time, GDP(ppp-$) and the investment strategy of Norway’s Oil Fund.