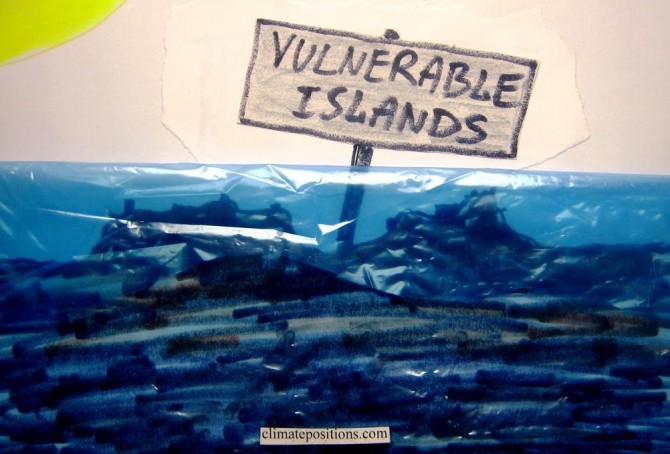
New at COP21: The Vulnerable Twenty Group (V20)
2015
Prior to COP21 in Paris in December twenty countries most at risk from the effects of global warming has formed ‘The Vulnerable Twenty Group (V20)’. Unified, the new group hopes for greater access to climate finance for adaptation and mitigation. The twenty countries representing almost one-tenth of the world’s population are: Bangladesh, Philippines, Ethiopia, Vietnam, Tanzania, Kenya, Afghanistan, Nepal, Ghana, Madagascar, Rwanda, Costa Rica, Bhutan, Timor-Leste, Maldives, Barbados, Vanuatu, Saint Lucia, Kiribati and Tuvalu. The first thirteen on the list have full data in ClimatePositions and they are all Contribution Free (no Climate Debt) among 147 countries (see the ‘ranking’). The last seven are examined below in terms of climate change performance.
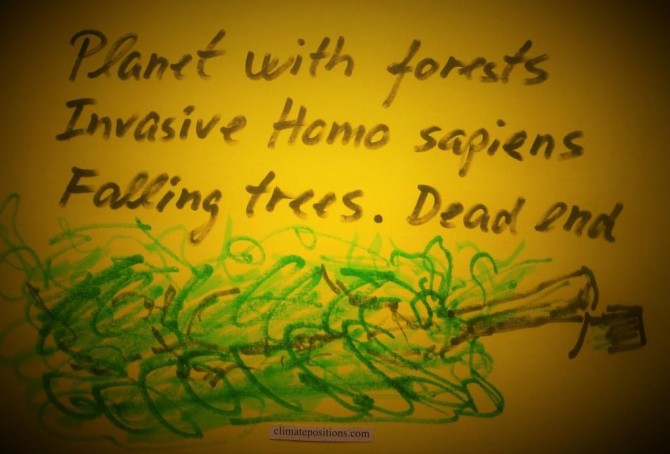
Forest Cover updates 2015 (and the number of trees on the planet)
2015
The United Nations site for the ‘Millennium Development Goals Indicators’ (MDG Indicators) has published the estimated Forest Cover as percentage of land area of 225 countries. The table at the bottom includes only 83 selected countries with Climate Debt in ClimatePositions (the fraction of the Climate Debt caused by Forest Cover-change is revealed). However, Forest Cover alone is a poor ecosystem-indicator and therefore the area with the precious Primary Forests is also included in ClimatePositions (read the article ‘Forest Cover, Primary Forests and Climate Debt’).
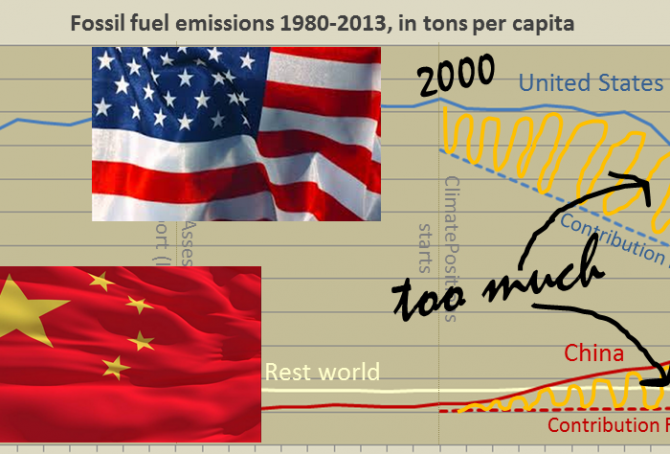
Per capita fossil fuel Carbon Dioxide Emissions: China vs. United States
2015
In different ways, China and the United States are main responsible for the continuing Climate Destruction. Combined the two superpowers, holding 24% of the world population, emitted 43% of the global CO2 from fossil fuels in 2012 and they accounted for 47% of the global Climate Debt¹. Had the two countries consistently promoted a fair and globally binding climate agreement, not thwarted it, then COP21 in Paris in December would not be such an incomprehensible mission impossible². The diagram below shows the per capita fossil fuel carbon dioxide emissions, between 1980 and 2013, of China, the United States and Rest World. The stippled lines indicate the Contribution Free Level of CO2 Emissions in ClimatePositions. More comments below the diagram.