
Global ocean temperature January-April 2016 is scary news too (see the graph 1880-2016)
More than 90% of the additional heat trapped in the atmosphere due to human caused greenhouse gases such as carbon dioxide from burning of Fossil Fuels, is absorbed by the oceans. In continuation of the previous ‘Article’ the global ocean (air) temperature January-April 2016 was around 1.0ºC higher than the average temperature January-April between 1880 and 1937 (calculated by ClimatePositions) – see the graph. The black line shows the 136-year-trend. Compose your own graph at ‘http://www.ncdc.noaa.gov/cag/time-series/global’.

Global land temperature January-April is creepy feverish (see the graph 1880-2016)
The world’s two largest economies and carbon dioxide emitters, the United States and China, have thwarted the negotiations toward a globally binding climate agreement for decades. Instead, the world is left with “intended nationally defined contributions” and the “aggregate emission pathways consistent with holding the increase in the global average temperature to well below 2°C above preindustrial levels and pursuing efforts to limit the temperature increase to 1.5°C.” This is of cause warm air, so to speak.
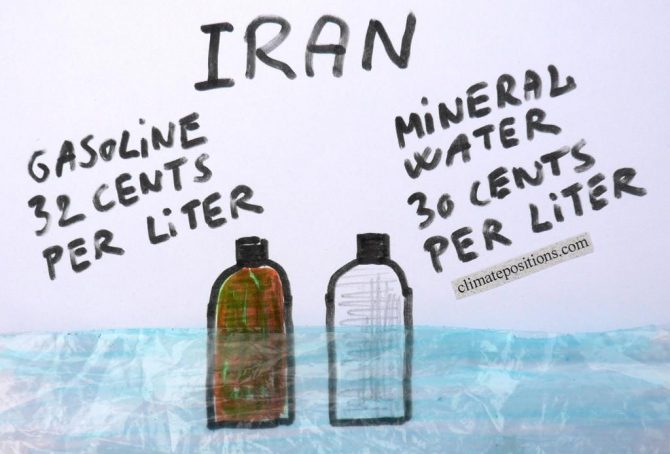
Climate Debt: Iran ranks 33rd (performance of the twenty most populous Muslim countries)
The twenty most populous countries with more than 85% Muslim majority (here called Muslim-20) represent 16.2% of the global population and 7.3% of the global Climate Debt in ClimatePositions. The average climate performance of the Muslim world is superior to the world average, so to speak. Among Muslim-20 Iran ranks 2nd (33rd among 148 countries) on Climate Debt per capita only surpassed by the climate-change-monster of Saudi Arabia.

Climate Debt: Australia ranks 8th (performance of the twenty largest coal producers)
2016
Australia covers around 5.7% of planet’s land area and populates 0.3% of its people. The Climate Debt of the 24 million Australian’s amounts to $132 billion, or $5,613 per capita, which ‘Ranks’ Australia 8th among 148 countries – in 2010 the ranking was 6th. Australia is the world’s 5th largest coal producer and the 2nd largest per capita CO2 emitter from coal combustion … and coal is the most efficient climate destroyer. The table below reveals some key figures of the world’s twenty largest coal producers. Subsequently, Australia’s climate change performance is examined in comparison with four other top-five countries on CO2 Emissions from coal combustion (per capita): Kazakhstan (ranked 1), South Africa (3), the United States (4) and Poland (5).