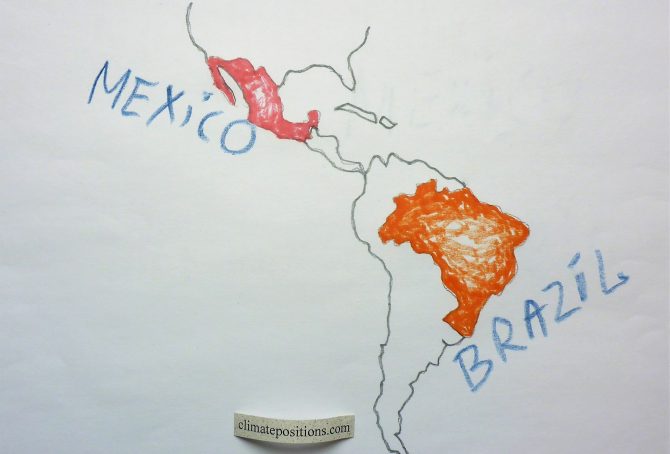
Climate change performance: Brazil vs. Mexico
2017
Brazil and Mexico are the world’s 11th and 12th largest emitters of CO2 from Fossil Fuels and cement. Combined, the two countries were responsible for 2.8% of world CO2 Emissions in 2015. The following examines the ‘Indicators‘ of CO2 Emissions, GDP(ppp-$), Forest Cover, Primary Forest and Ecological Footprint (without carbon footprint).
The diagrams below show the per capita CO2 Emissions from Fossil Fuel (without bunkers) and cement, since 2000. The green bars show the Free Emission Level¹ – the exceedance is the basis for calculating the national Climate Debt.
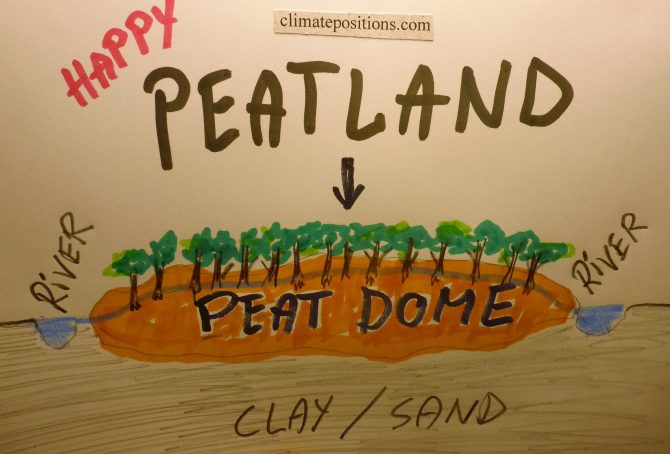
Climate change performance: South Korea vs. Indonesia (peatlands in Southeast Asia)
2017
In 2015 South Korea and Indonesia accounted for 3.60% and 0.51% of the global Climate Debt, respectively (see the ‘Ranking‘). The following examines the ‘Indicators‘ of CO2 Emissions, GDP(ppp-$), Forest Cover (and peatlands) and Primary Forest.
The first two diagrams show the per capita CO2 Emissions from Fossil Fuel (without bunkers) and cement, annually since 2000, of South Korea and Indonesia. The green bars show the Free Emission Level¹ – the exceedance is the basis for calculating the national Climate Debt. The world’s 9th and 10th largest CO2-emitters were responsible for 1.7% (South Korea) and 1.5% (Indonesia) of global emissions in 2015, respectively. South Korea’s per capita emissions were 11.7 tons in 2015 (preliminary), while Indonesia’s were 2.1 tons (preliminary), which was 2.2% above the 2014-level.

Global warming: pre-industrial temperature, baselines, measurements and the 2C limit
2017
194 countries have agreed to hold the increase in the global average temperature to well below 2°C above pre-industrial levels. However, neither “global average temperature” nor “pre-industrial levels” are defined in the agreement. Furthermore, different scientific groups produce different temperature datasets, which are not exactly the same because of differences in the methodologies (and to complete the absurdity, the Paris Agreement contains no binding national emission pathways to the overall goal). The following temperature survey refers to datasets from ‘National Oceanic and Atmospheric Administration (NOAA)‘.
The diagram below shows the global surface (air) temperature 1880-2016 over 1) Land, 2) Ocean and 3) Land/Ocean combined (which is most commonly used). All three baselines are 1880-1937 (set at 0°C) and the dashed lines show the average trends. Apparently, global (air) warming happens considerably faster on land than on oceans. By the way, the global warming in 2016, baseline 1880-1937, was 1.73°C (Land), 0.94°C (Ocean) and 1.15°C (Land/Ocean).
Added 07-02-2017: Soon, the global temperature ‘Indicator’ in ClimatePosition will be changed from Land (air) Temperature (10-years average) to Land/Ocean (air) Temperature (10-years average). The change will not affect the current accumulated Climate Debt of any country, only the future calculation.