World Carbon Emissions from Fossil Fuels and the required reduction line in ClimatePositions (emissions of three country groups by Climate Debt)
If all 97 countries with Climate Debt (see the ‘Ranking‘), had cut national emissions as required in ClimatePositions, then World Carbon Emissions would have dropped significantly as demonstrated in the diagram below. World Carbon Emissions from Fossil Fuels (without bunker¹) and cement amounted a total of 312 GtC (Gigaton Carbon) between 1960 and 2015 … however with the required cuts, emissions would have been 270 GtC, or 14% less … and no countries would have Climate Debt.
Recent analysis² suggest a small 0.2% growth of emission in 2016 compared to 2015 – and that four more years of current emissions “would be enough to blow what’s left of the carbon budget for a good chance of keeping global temperature rise to 1.5C.” Not so smart!

Climate change performance: Malaysia vs. Spain
2017
Malaysia and Spain are the world’s 23rd and 24th largest emitters of CO2 from Fossil Fuels and cement. Combined, the two countries were responsible for 1.4% of world CO2 Emissions in 2015. The following examines the ‘Indicators‘ of CO2 Emissions, GDP(ppp-$), Forest Cover (and Primary Forest) and Environmental Performance.
The diagrams below show the per capita CO2 Emissions from Fossil Fuel (without bunkers) and cement, since 2000. The green bars show the Free Emission Level¹ – the exceedance is the basis for calculating the national Climate Debt. The Spanish reductions are pretty much balanced by the Malaysian increases … which is world symptomatic.
Climate change performance: Kazakhstan vs. Poland
2017
In 2015 Kazakhstan and Poland were the world’s 2nd and 4th largest per capita coal producers. No wonder, the two countries, inhabited by 0.76% of the global population, emitted as much as 1.58% of the CO2 from Fossil Fuels (without bunkers) and cement.
The diagrams below show the per capita CO2 Emissions from Fossil Fuels (without bunkers) and cement, annually since 2000. The green bars show the Free Emission Level¹ – the exceedance is the basis for calculating the national Climate Debt.
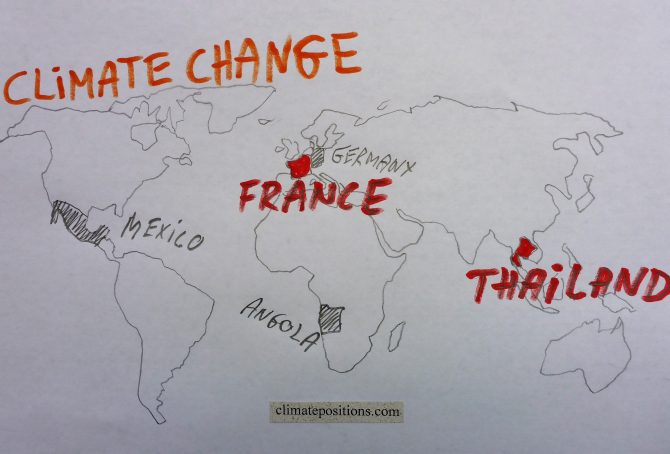
Climate change performance: Thailand vs. France
2017
Thailand and France are the world’s 19th and 20th largest emitters of CO2 from Fossil Fuels and cement. Combined, the two countries were responsible for 1.8% of world CO2 Emissions in 2015. The following examines the ‘Indicators‘ of CO2 Emissions, GDP(ppp-$), Ecological Footprint, Forest Cover and Nuclear Power.
The diagrams below show the per capita CO2 Emissions from Fossil Fuel (without bunkers) and cement, since 2000. The green bars show the Free Emission Level¹ – the exceedance is the basis for calculating the national Climate Debt.