
Global Carbon Project (CDIAC), located in the United States, stops publishing carbon emissions data by country – will be replaced by EDGAR in ClimatePositions
2017
The Carbon Dioxide Information Analysis Center (CDIAC), located at the U.S. Department of Energy’s (DOE) Oak Ridge National Laboratory, has published annual Carbon Emissions from Fossil Fuels and cement production by country since 1959 (‘Global Carbon Project‘), but now this continuous time series has come to an end and 2015 will be the last data-year (as it seems).
Since carbon emissions data from CDIAC (Global Carbon Project) is the core ‘Indicator‘ in ClimatePositions’ calculation of Climate Debt, carbon emissions data will be replaced with nearly similar data from ‘EDGAR‘ (‘European Commission‘ / ‘Climate Action‘), retroactively since 1990, in connection with the coming updates [done 16-08-2017].
The following describes the differences between CO2 Emissions data from Global Carbon Project (CDIAC) and EDGAR (sourced: European Commission, Joint Research Centre (JRC)/Netherlands Environmental Assessment Agency (PBL). Emission Database for Global Atmospheric Research (EDGAR)), and the consequences in terms of Climate Debt in ClimatePositions – illustrated with a range of country examples. Note that other sources, such as ‘IEA‘, ‘EIA‘ and ‘BP‘, provides CO2 Emissions data-sets different from the ones of CDIAC and EDGAR.
Climate change performance: 62 countries without Climate Debt (compared to Boycott Group A & B)
2017
Only 62 countries among 159 with full data in ClimatePositions are without Climate Debt (see the ‘Ranking‘). The 62 countries (Group-62) are in alphabetic order: Afghanistan, Azerbaijan, Bangladesh, Benin, Bhutan, Burkina Faso, Burundi, Cambodia, Cameroon, Central African Rep., Chad, Colombia, Comoros, Congo (Brazzaville), Costa Rica, Côte d’Ivoire, Cuba¹, Dem. Rep. Congo, El Salvador, Eritrea, Ethiopia, Gambia, Georgia, Ghana, Guinea, Guinea-Bissau, Haiti, Kenya, Kyrgyzstan, Laos, Latvia, Liberia, Madagascar, Malawi, Mali, Mauritania, Moldova, Mozambique, Namibia, Nepal, Nicaragua, Niger, Nigeria, Pakistan, Paraguay, Philippines, Rwanda, Senegal, Sierra Leone, Singapore, Solomon Islands, Sri Lanka, Sudan, Swaziland, Tajikistan, Tanzania, Timor-Leste, Togo, Uganda, Yemen, Zambia and Zimbabwe.
The table below shows Group-62s combined share of the world’s 1) Population, 2) Forest Cover, 3) Primary Forests, and 4) CO2 Emissions from Fossil Fuels (without bunker) and cement production.
Indicator updates: GDP-ppp 2016 and Climate Change Financing (now only Multilateral Funds)
2017
2016-updates of national per capita GDP(ppp-$) from ‘World Bank‘ is now available in ‘Calculation (Excel)‘. The world’s average per capita GDP(ppp-$) grew from $15,668 in 2015 to 16,136 in 2016 (3.0% growth). The diagram below shows the development in per capita GDP(ppp-$) 2000-2016 of the world’s five largest per capita emitters of CO2 from Fossil Fuel and cement: Qatar, Trinidad and Tobago, Kuwait, Bahrain and Brunei; in comparison with the world average.
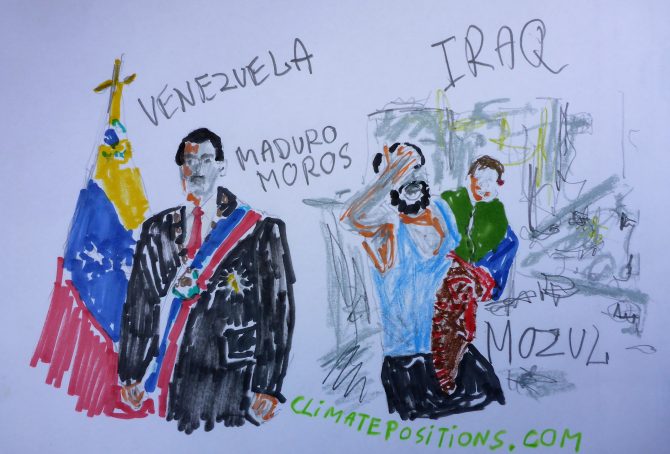
Climate change performance: Venezuela vs. Iraq (world’s proven reserves of oil and natural gas)
2017
Venezuela holds the world’s largest proven oil reserves and the 8th largest proven natural gas reserves, while Iraq ranks 5th on oil and 12th on gas. Together, the two countries hold nearly 27% of the world’s proven reserves of oil and 5% of its natural gas.
The two tables below rank the 15 countries with the largest proven oil and natural gas reserves and their world shares. Combined, the 19 Fossil Fuel countries listed below hold 93% of the world’s proven oil reserves and 88% of the proven natural gas reserves. They represent 38% of the global population, 62% of the global CO2 Emissions from Fossil Fuels (2015) and 74% of the current global Climate Debt in ClimatePositions (the combined share of the global Climate Debt of the 15 countries has increased by 3.6% since 2012; see the ‘Ranking‘.