United States: Per Capita Climate Debt $6,870 (Ranked 8) – Fossil CO2 Emissions
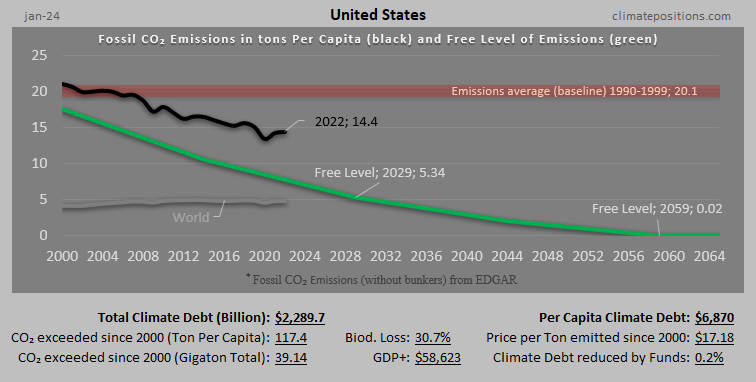
In 2024, United States is responsible for 29.26% of the Global Climate Debt accumulated since 2000. Below are some key figures in the calculations.
Canada: Per Capita Climate Debt $6,161 (Ranked 12) – Fossil CO2 Emissions
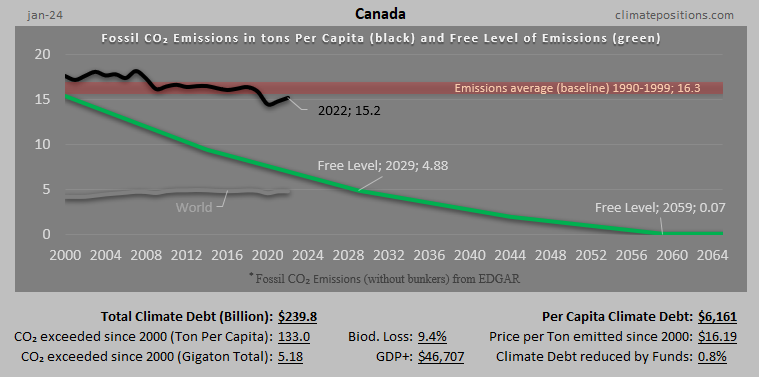
In 2024, Canada is responsible for 3.07% of the Global Climate Debt accumulated since 2000. Below are some key figures in the calculations.
South Korea: Per Capita Climate Debt $5,464 (Ranked 14) – Fossil CO2 Emissions
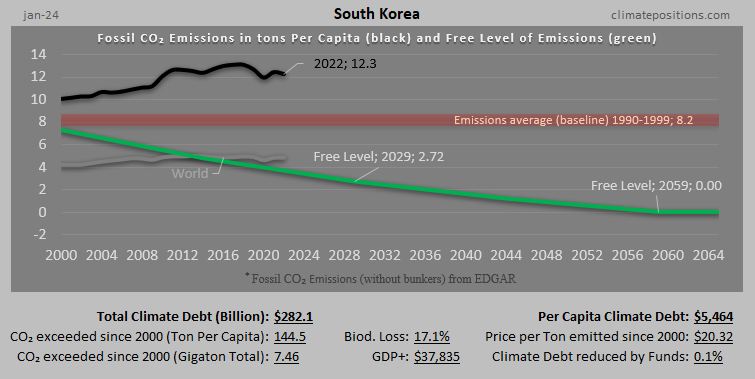
In 2024, South Korea is responsible for 3.61% of the Global Climate Debt accumulated since 2000. Below are some key figures in the calculations.
United Arab Emirates: Per Capita Climate Debt $4,444 (Ranked 16) – Fossil CO2 Emissions
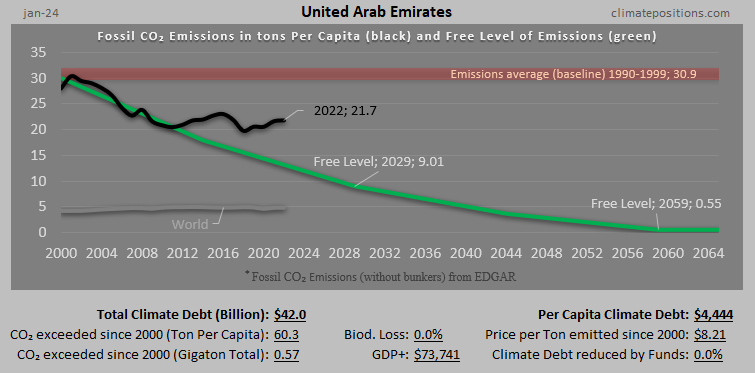
In 2024, United Arab Emirates is responsible for 0.54% of the Global Climate Debt accumulated since 2000. Below are some key figures in the calculations.
Netherlands: Per Capita Climate Debt $3,770 (Ranked 17) – Fossil CO2 Emissions
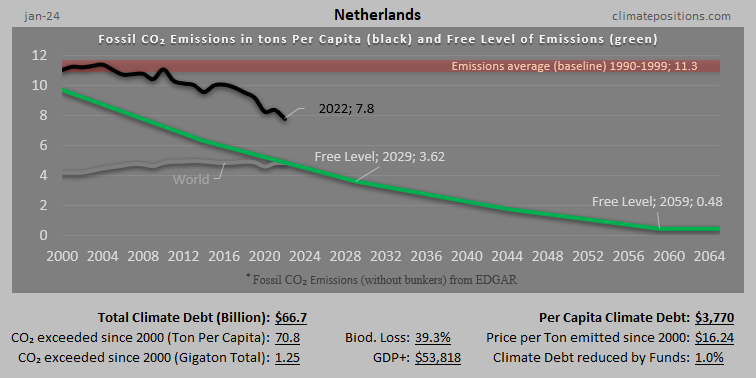
In 2024, Netherlands is responsible for 0.85% of the Global Climate Debt accumulated since 2000. Below are some key figures in the calculations.
Belgium: Per Capita Climate Debt $2,877 (Ranked 19) – Fossil CO2 Emissions
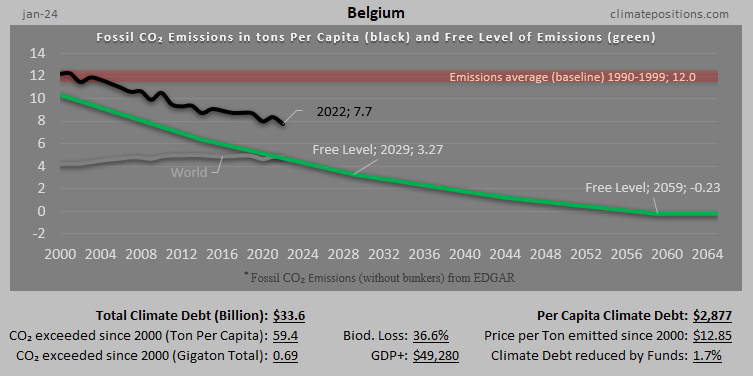
In 2024, Belgium is responsible for 0.43% of the Global Climate Debt accumulated since 2000. Below are some key figures in the calculations.
Czech Republic: Per Capita Climate Debt $2,685 (Ranked 22) – Fossil CO2 Emissions
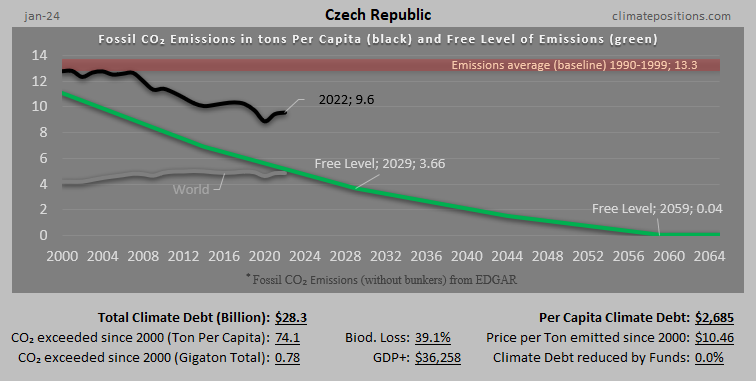
In 2024, Czech Republic is responsible for 0.36% of the Global Climate Debt accumulated since 2000. Below are some key figures in the calculations.
Germany: Per Capita Climate Debt $2,590 (Ranked 23) – Fossil CO2 Emissions

In 2024, Germany is responsible for 2.78% of the Global Climate Debt accumulated since 2000. Below are some key figures in the calculations.
Japan: Per Capita Climate Debt $2,527 (Ranked 24) – Fossil CO2 Emissions

In 2024, Japan is responsible for 4.04% of the Global Climate Debt accumulated since 2000. Below are some key figures in the calculations.
Finland: Per Capita Climate Debt $2,504 (Ranked 25) – Fossil CO2 Emissions
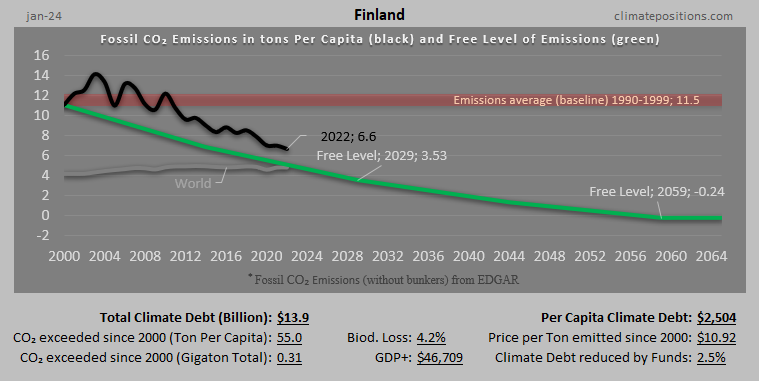
In 2024, Finland is responsible for 0.18% of the Global Climate Debt accumulated since 2000. Below are some key figures in the calculations.
Slovenia: Per Capita Climate Debt $2,336 (Ranked 28) – Fossil CO2 Emissions
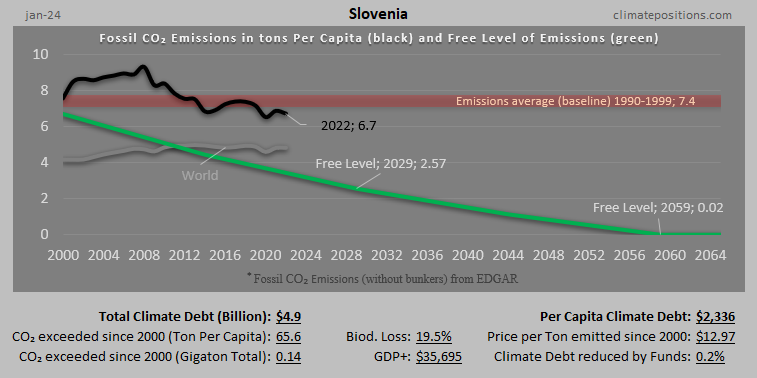
In 2024, Slovenia is responsible for 0.063% of the Global Climate Debt accumulated since 2000. Below are some key figures in the calculations.
Russia: Per Capita Climate Debt $2,058 (Ranked 30) – Fossil CO2 Emissions
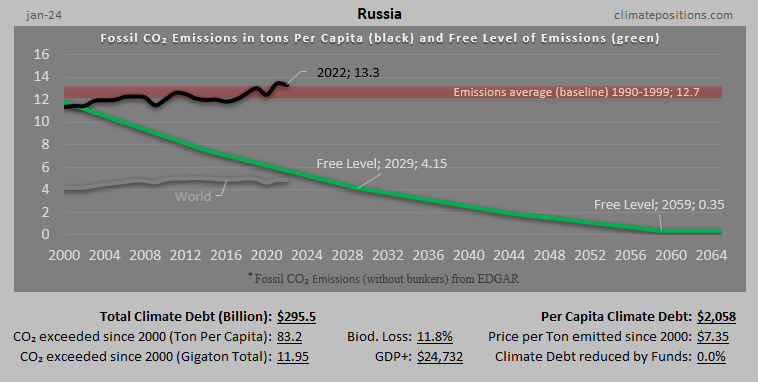
In 2024, Russia is responsible for 3.78% of the Global Climate Debt accumulated since 2000. Below are some key figures in the calculations.
Spain: Per Capita Climate Debt $1,972 (Ranked 31) – Fossil CO2 Emissions

In 2024, Spain is responsible for 1.20% of the Global Climate Debt accumulated since 2000. Below are some key figures in the calculations.
Switzerland: Per Capita Climate Debt $1,797 (Ranked 34) – Fossil CO2 Emissions
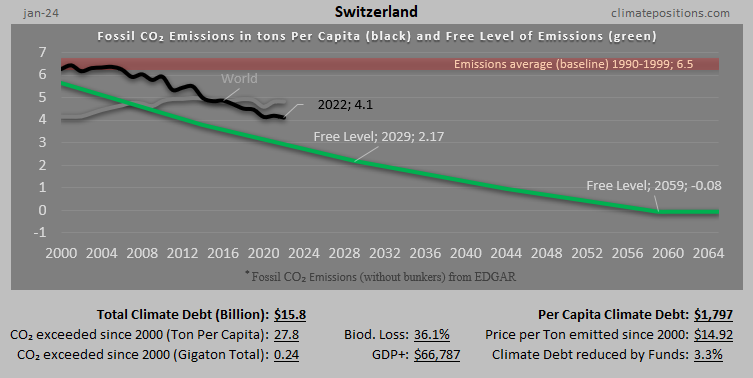
In 2024, Switzerland is responsible for 0.20% of the Global Climate Debt accumulated since 2000. Below are some key figures in the calculations.
France: Per Capita Climate Debt $1,707 (Ranked 36) – Fossil CO2 Emissions

In 2024, France is responsible for 1.48% of the Global Climate Debt accumulated since 2000. Below are some key figures in the calculations.
United Kingdom: Per Capita Climate Debt $1,584 (Ranked 37) – Fossil CO2 Emissions

In 2024, United Kingdom is responsible for 1.36% of the Global Climate Debt accumulated since 2000. Below are some key figures in the calculations.
Iran: Per Capita Climate Debt $1,321 (Ranked 43) – Fossil CO2 Emissions
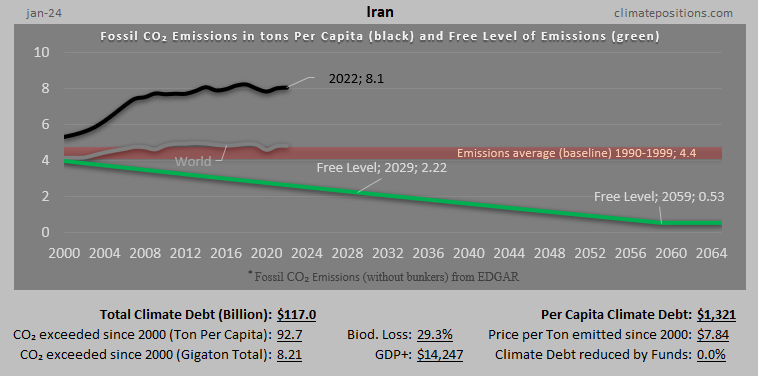
In 2024, Iran is responsible for 0.49% of the Global Climate Debt accumulated since 2000. Below are some key figures in the calculations.
China: Per Capita Climate Debt $1,240 (Ranked 44) – Fossil CO2 Emissions
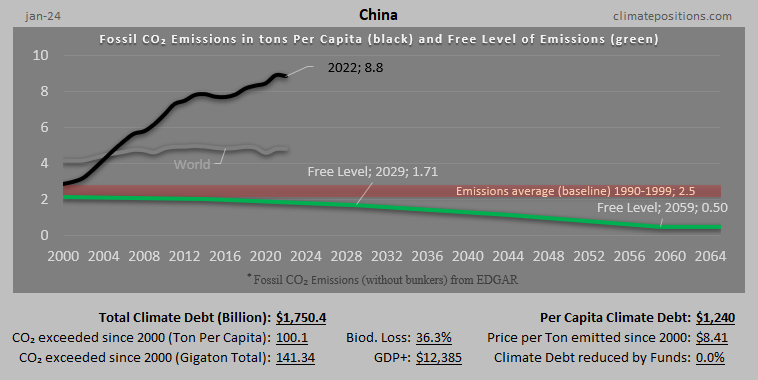
In 2024, China is responsible for 22.37% of the Global Climate Debt accumulated since 2000. Below are some key figures in the calculations.
Slovakia: Per Capita Climate Debt $1,025 (Ranked 49) – Fossil CO2 Emissions
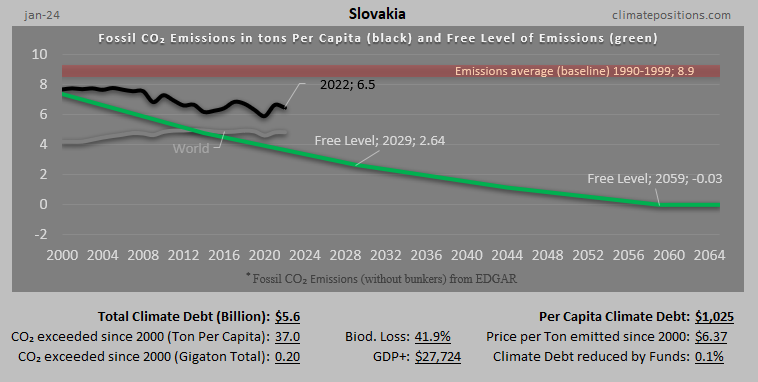
In 2024, Slovakia is responsible for 0.071% of the Global Climate Debt accumulated since 2000. Below are some key figures in the calculations.