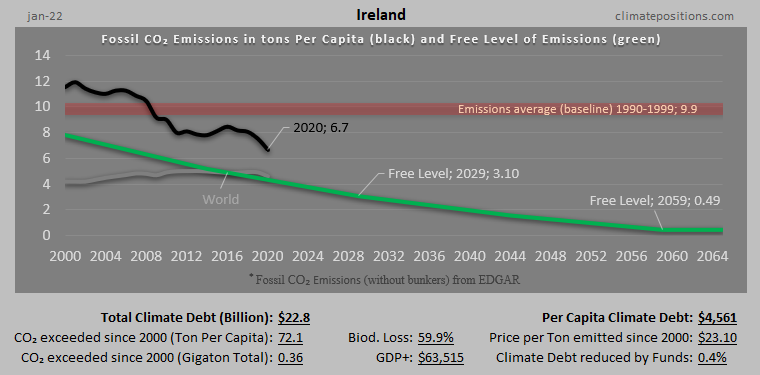
Ireland: Per Capita Climate Debt $5,984 (Ranked 13) – Fossil CO2 Emissions

In 2024, Ireland is responsible for 0.39% of the Global Climate Debt accumulated since 2000. Below are some key figures in the calculations.

United Kingdom – per capita Fossil CO2 Emissions and Climate Debt
2020
The current Climate Breakdown Pricing of the United Kingdom amounts to $11.17 per tons Fossil CO2 emitted since 2000. The Climate Debt grew from $871 per capita in 2015 to $1,614 in 2020. Updated Rankings of 165 countries are available in the menu “Climate Debt”.
The following diagrams expose the trends of Fossil CO2 Emissions, Climate Debt, GDP(ppp-$), Nuclear Power and Ecological Footprint without carbon.
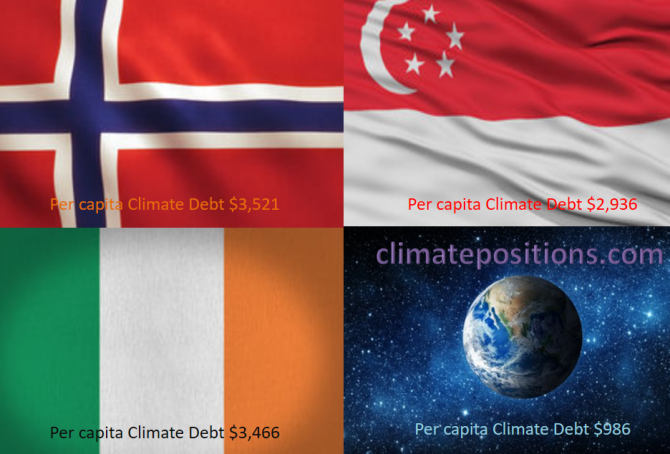
Share of global Climate Debt rank 37th, 38th and 39th: Norway, Ireland and Singapore (combined responsible for 0.71% of Climate Debt and 0.37% of Fossil CO2 Emissions 2016)
2017
The diagram below shows ‘Share of global Climate Debt‘ in 2010, 2015 and 2017 of Norway, Ireland and Singapore (ranked 37th, 38th and 39th). Norway’s share is decreasing, whereas Singapore’s is increasing. Ireland’s impressive decrease seems to have reversed lately.
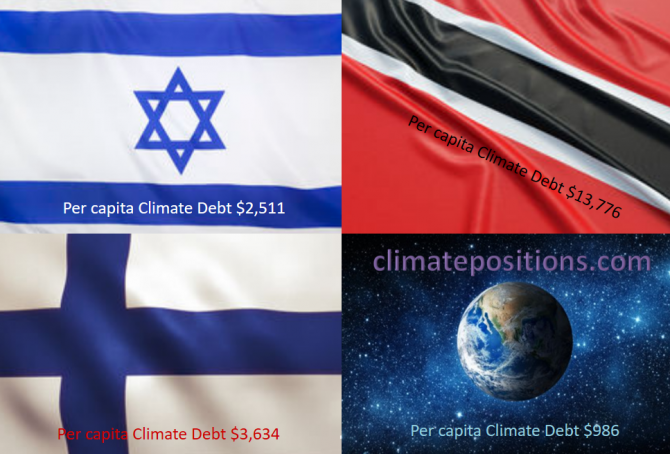
Share of global Climate Debt rank 34th, 35th and 36th: Israel, Finland and Trinidad and Tobago (combined responsible for 0.83% of Climate Debt and 0.42% of Fossil CO2 Emissions 2016)
2017
The diagram below shows ‘Share of global Climate Debt‘ in 2010, 2015 and 2017 of Israel, Finland and Trinidad and Tobago (ranked 34th, 35th and 36th). The shares of Israel and Finland have decreased continuously, whereas the one of Trinidad and Tobago is nearly stable.

Climate change performance: The United Kingdom vs. Australia
2017
The United Kingdom and Australia and are the world’s 15th and 16th largest emitters of CO2 from Fossil Fuels and cement. Combined, the two countries were responsible for 2.2% of world CO2 Emissions in 2015. The following examines the ‘Indicators’ of CO2 Emissions, GDP(ppp-$) and Ecological Footprint (without carbon footprint).
The diagrams below show the per capita CO2 Emissions from Fossil Fuel (without bunkers) and cement, since 2000. The green bars show the Free Emission Level¹ – the exceedance is the basis for calculating the national Climate Debt.

Climate Debt: Ireland ranks 14th … however, with significant CO2 reductions over the last decade
2016
Ireland’s current Climate Debt is $2,704 per capita and the ‘Ranking’ by January 2016 was 14th among 148 countries. The following examines the Irish climate change performance in comparison with the United Kingdom, France, Canada and the United States.
The first diagram shows Ireland’s per capita CO2 Emissions from fossil fuels (without bunker fuels) and cement production in decades in comparison with the world average. CO2 Emissions since 2012 are preliminary estimates. From 9.4 tons emitted in the 1990s the level increased to 10.4 tons on average between 2000 and 2009 – and then dropped to 8.0 tons on average between 2010 and 2014 (preliminary). The green bars are the Contribution Free Level in ClimatePositions, determined by the level of emissions in the 1990s and a number of continuously updated ‘Indicators’.

Climate Debt: Norway ranks 9th (performance of top twenty from Human Development Index)
The so called ‘Human Development Index 2015’ (UN) ranks Norway 1st among 188 countries. The index is based on 1) Life expectancy at birth, 2) Expected years of schooling, 3) Mean years of schooling and 4) Gross national income (GNI) per capita. However, the wealthy Scandinavian oil state ‘Ranks‘ 9th among 148 countries on Climate Debt per capita. Norway is in other words a highly human developed demolisher of the climate, one might say! The following examines the climate performance of Norway in comparison with the other top five countries from Human Development Index: Australia, Switzerland, Denmark and Netherland.
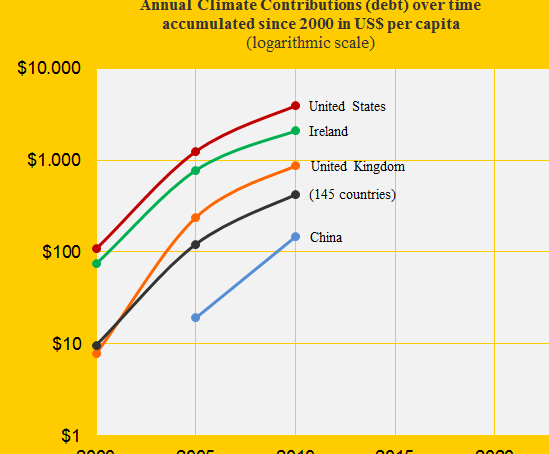
Climate performance: United Kingdom versus Ireland
2014
In ClimatePositions 2010, United Kingdom was the 26th worst performing country while Ireland was number 14 out of 145. The first diagram shows the two countries’ Climate Contributions (climate debt) per capita over time in comparison with the United States, China and the world average (note the logarithmic scale). See the changes in Climate Contributions per capita since 2010 ‘here’).
Climate Change Performance Index 2013
2013
‘Climate Change Performance Index 2013’ is a ranking of 58 countries that was published recently by ‘Germanwatch’ and ‘Climate Action Network Europe’ – with the help of over 230 experts worldwide. 80% of the evaluation is based on indicators of emissions (30% for emissions levels and 30% for recent development of emissions), efficiency (5% level of efficiency and 5% recent development in efficiency) and renewable energy (8% recent development and 2% share of total primary energy supply). For the first time emissions from deforestation is included. The remaining 20% of the evaluation is based on national and international climate policy assessments by experts from the respective countries.