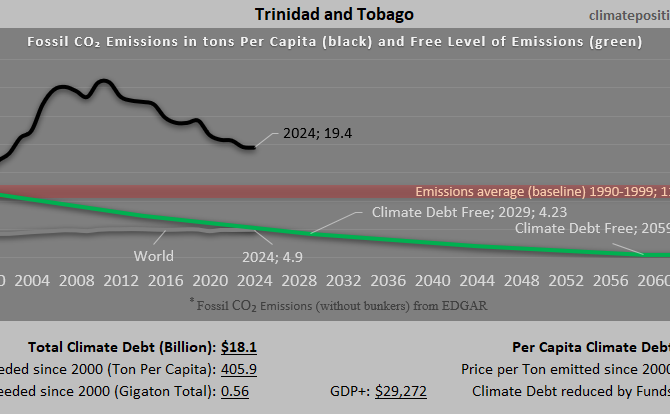
Climate Debt of Trinidad and Tobago 2025: $18.1 Billion or 0.19% of the Global Climate Debt (or $13202 Per Capita)
/2025/ Trinidad and Tobago ranks 5th in Climate Debt Per Capita accumulated 2000-2025. Below are some key figures in the calculations. The diagram above shows the Fossil CO2 Emissions Per Capita and the Free Level of emissions (green). The wide straight red line shows emissions in the 1990s (baseline in the calculations).
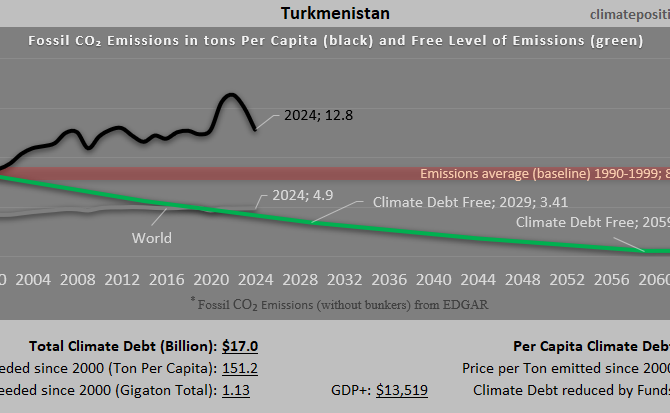
Climate Debt of Turkmenistan 2025: $17.0 Billion or 0.18% of the Global Climate Debt (or $2272 Per Capita)
/2025/ Turkmenistan ranks 28th in Climate Debt Per Capita accumulated 2000-2025. Below are some key figures in the calculations. The diagram above shows the Fossil CO2 Emissions Per Capita and the Free Level of emissions (green). The wide straight red line shows emissions in the 1990s (baseline in the calculations).
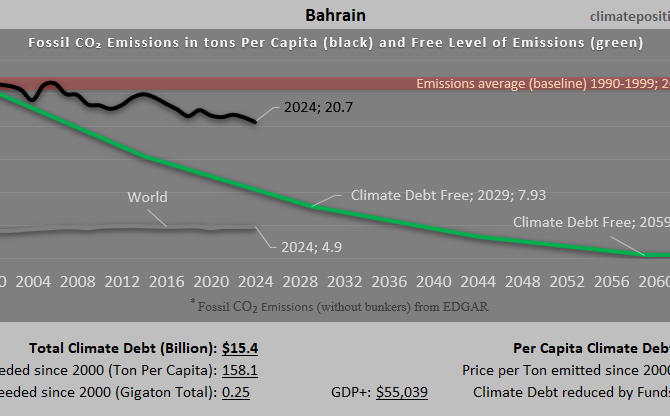
Climate Debt of Bahrain 2025: $15.4 Billion or 0.17% of the Global Climate Debt (or $9667 Per Capita)
/2025/ Bahrain ranks 7th in Climate Debt Per Capita accumulated 2000-2025. Below are some key figures in the calculations. The diagram above shows the Fossil CO2 Emissions Per Capita and the Free Level of emissions (green). The wide straight red line shows emissions in the 1990s (baseline in the calculations).
| Bahrain | Climate Debt accumulated 2000-2025 | |
| . | . | |
Climate Damage Pricing |
$9,667.21 |
Per Capita |
Climate Damage Pricing, Total |
$15,358,006,289 |
Total |
Climate Funds (Damage paid for) |
$0.00 |
Per Capita |
Climate Funds, Total (Damage paid for) |
$0 |
Total |
Climate Debt, Total |
$15,358,006,289 |
Total |
Price per tons CO₂ emitted since 2000 |
$16.25 |
Per Ton |
Climate Debt reduced by Funds |
0.0000% |
|
Climate Debt as share of GDP+ |
17.6% |
|
Climate Debt |
$9,667 |
Per Capita |
Climate Debt, Total |
$15.358 |
Billion |
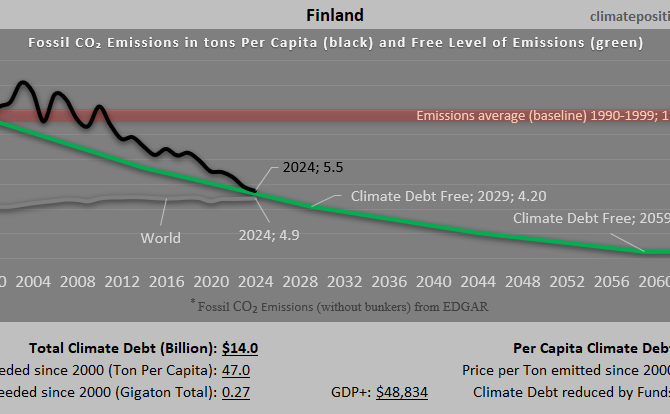
Climate Debt of Finland 2025: $14.0 Billion or 0.15% of the Global Climate Debt (or $2475 Per Capita)
/2025/ Finland ranks 25th in Climate Debt Per Capita accumulated 2000-2025. Below are some key figures in the calculations. The diagram above shows the Fossil CO2 Emissions Per Capita and the Free Level of emissions (green). The wide straight red line shows emissions in the 1990s (baseline in the calculations).

Climate Debt of Greece 2025: $13.8 Billion or 0.15% of the Global Climate Debt (or $1327 Per Capita)
/2025/ Greece ranks 43rd in Climate Debt Per Capita accumulated 2000-2025. Below are some key figures in the calculations. The diagram above shows the Fossil CO2 Emissions Per Capita and the Free Level of emissions (green). The wide straight red line shows emissions in the 1990s (baseline in the calculations).
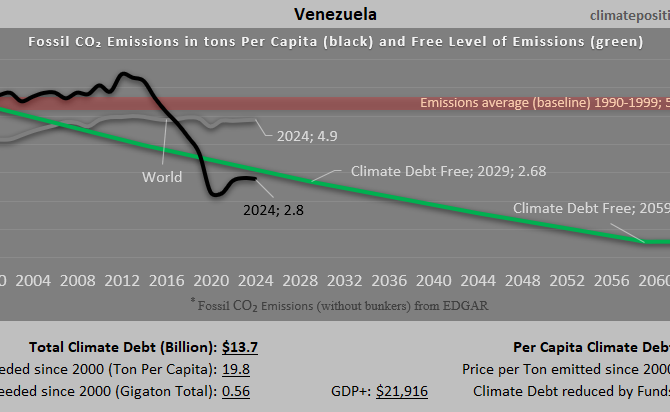
Climate Debt of Venezuela 2025: $13.7 Billion or 0.15% of the Global Climate Debt (or $482 Per Capita)
/2025/ Venezuela ranks 65th in Climate Debt Per Capita accumulated 2000-2025. Below are some key figures in the calculations. The diagram above shows the Fossil CO2 Emissions Per Capita and the Free Level of emissions (green). The wide straight red line shows emissions in the 1990s (baseline in the calculations).
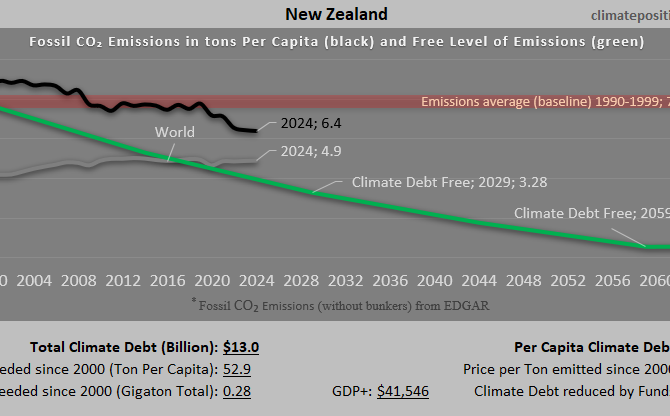
Climate Debt of New Zealand 2025: $13.0 Billion or 0.14% of the Global Climate Debt (or $2434 Per Capita)
/2025/ New Zealand ranks 27th in Climate Debt Per Capita accumulated 2000-2025. Below are some key figures in the calculations. The diagram above shows the Fossil CO2 Emissions Per Capita and the Free Level of emissions (green). The wide straight red line shows emissions in the 1990s (baseline in the calculations).
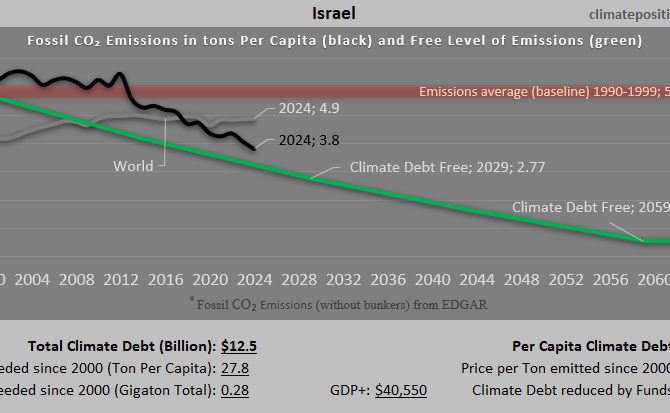
Climate Debt of Israel 2025: $12.5 Billion or 0.14% of the Global Climate Debt (or $1255 Per Capita)
/2025/ Israel ranks 44th in Climate Debt Per Capita accumulated 2000-2025. Below are some key figures in the calculations. The diagram above shows the Fossil CO2 Emissions Per Capita and the Free Level of emissions (green). The wide straight red line shows emissions in the 1990s (baseline in the calculations).
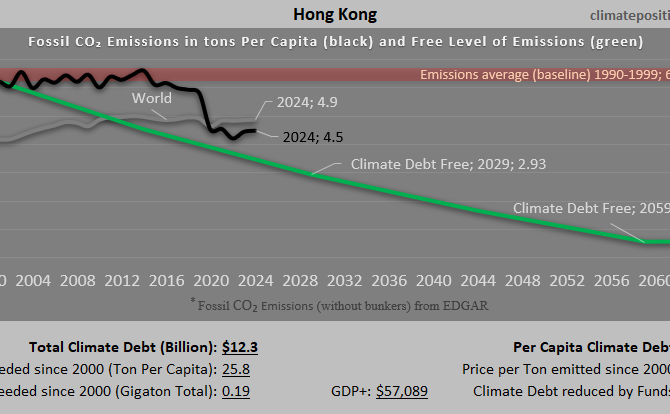
Climate Debt of Hong Kong 2025: $12.3 Billion or 0.13% of the Global Climate Debt (or $1636 Per Capita)
/2025/ Hong Kong ranks 37th in Climate Debt Per Capita accumulated 2000-2025. Below are some key figures in the calculations. The diagram above shows the Fossil CO2 Emissions Per Capita and the Free Level of emissions (green). The wide straight red line shows emissions in the 1990s (baseline in the calculations).

Climate Debt of Portugal 2025: $11.8 Billion or 0.13% of the Global Climate Debt (or $1100 Per Capita)
/2025/ Portugal ranks 49th in Climate Debt Per Capita accumulated 2000-2025. Below are some key figures in the calculations. The diagram above shows the Fossil CO2 Emissions Per Capita and the Free Level of emissions (green). The wide straight red line shows emissions in the 1990s (baseline in the calculations).
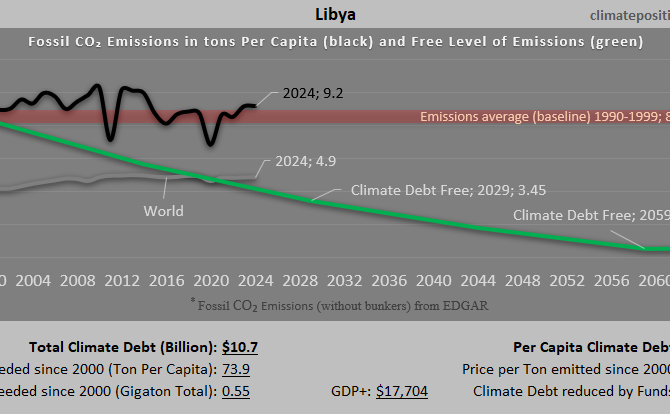
Climate Debt of Libya 2025: $10.7 Billion or 0.12% of the Global Climate Debt (or $1453 Per Capita)
/2025/ Libya ranks 40th in Climate Debt Per Capita accumulated 2000-2025. Below are some key figures in the calculations. The diagram above shows the Fossil CO2 Emissions Per Capita and the Free Level of emissions (green). The wide straight red line shows emissions in the 1990s (baseline in the calculations).
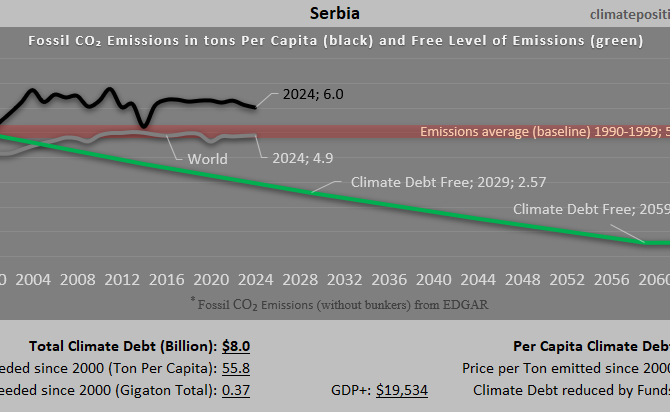
Climate Debt of Serbia 2025: $8.0 Billion or 0.09% of the Global Climate Debt (or $1211 Per Capita)
/2025/ Serbia ranks 47th in Climate Debt Per Capita accumulated 2000-2025. Below are some key figures in the calculations. The diagram above shows the Fossil CO2 Emissions Per Capita and the Free Level of emissions (green). The wide straight red line shows emissions in the 1990s (baseline in the calculations).
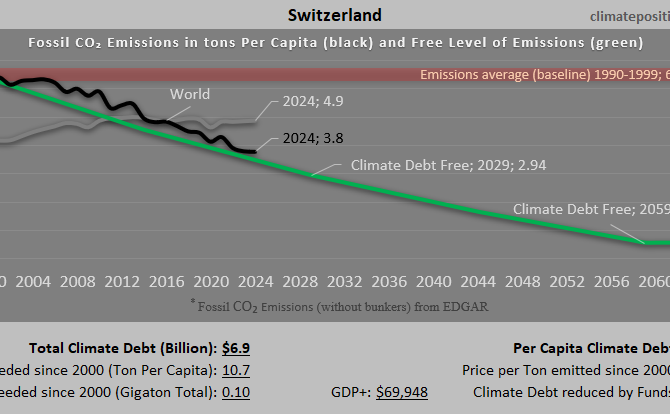
Climate Debt of Switzerland 2025: $6.9 Billion or 0.07% of the Global Climate Debt (or $759 Per Capita)
/2025/ Switzerland ranks 53rd in Climate Debt Per Capita accumulated 2000-2025. Below are some key figures in the calculations. The diagram above shows the Fossil CO2 Emissions Per Capita and the Free Level of emissions (green). The wide straight red line shows emissions in the 1990s (baseline in the calculations).
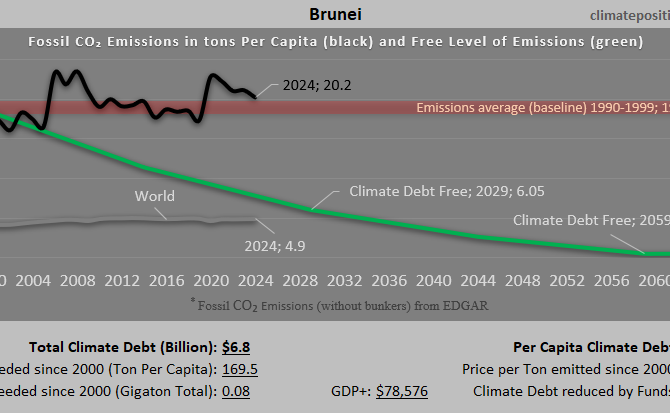
Climate Debt of Brunei 2025: $6.8 Billion or 0.07% of the Global Climate Debt (or $14798 Per Capita)
/2025/ Brunei ranks 3rd in Climate Debt Per Capita accumulated 2000-2025. Below are some key figures in the calculations. The diagram above shows the Fossil CO2 Emissions Per Capita and the Free Level of emissions (green). The wide straight red line shows emissions in the 1990s (baseline in the calculations).
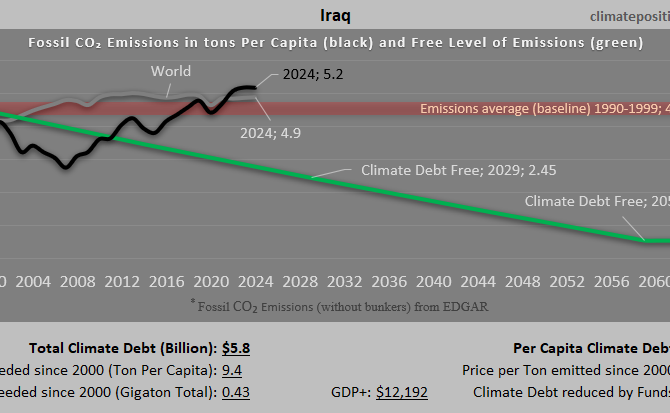
Climate Debt of Iraq 2025: $5.8 Billion or 0.06% of the Global Climate Debt (or $127 Per Capita)
/2025/ Iraq ranks 82nd in Climate Debt Per Capita accumulated 2000-2025. Below are some key figures in the calculations. The diagram above shows the Fossil CO2 Emissions Per Capita and the Free Level of emissions (green). The wide straight red line shows emissions in the 1990s (baseline in the calculations).
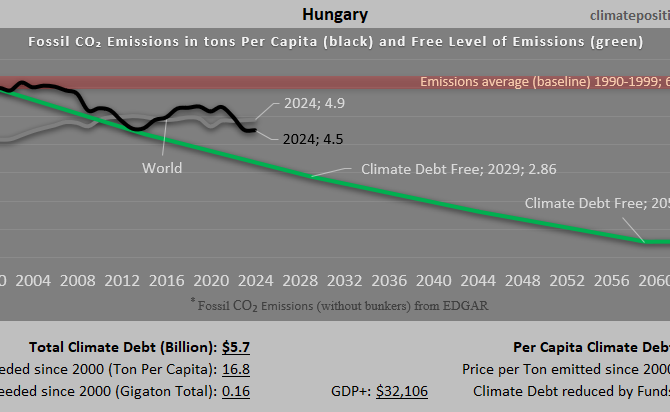
Climate Debt of Hungary 2025: $5.7 Billion or 0.06% of the Global Climate Debt (or $600 Per Capita)
/2025/ Hungary ranks 60th in Climate Debt Per Capita accumulated 2000-2025. Below are some key figures in the calculations. The diagram above shows the Fossil CO2 Emissions Per Capita and the Free Level of emissions (green). The wide straight red line shows emissions in the 1990s (baseline in the calculations).
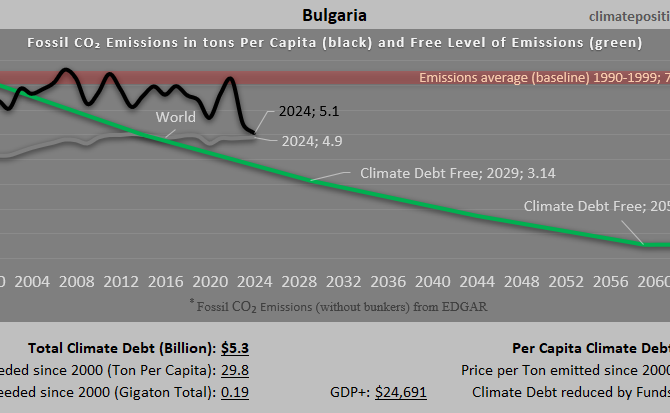
Climate Debt of Bulgaria 2025: $5.3 Billion or 0.06% of the Global Climate Debt (or $818 Per Capita)
/2025/ Bulgaria ranks 52nd in Climate Debt Per Capita accumulated 2000-2025. Below are some key figures in the calculations. The diagram above shows the Fossil CO2 Emissions Per Capita and the Free Level of emissions (green). The wide straight red line shows emissions in the 1990s (baseline in the calculations).
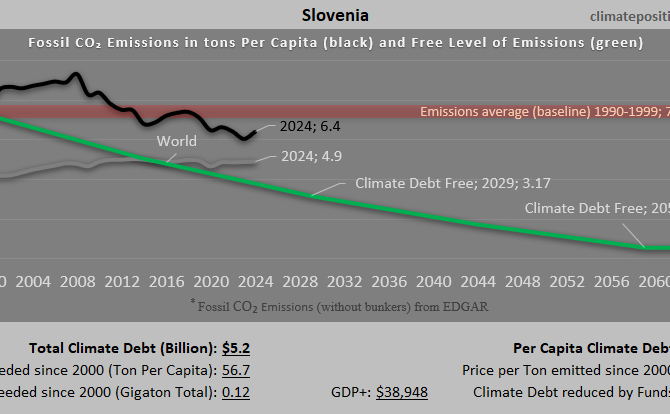
Climate Debt of Slovenia 2025: $5.2 Billion or 0.06% of the Global Climate Debt (or $2450 Per Capita)
/2025/ Slovenia ranks 26th in Climate Debt Per Capita accumulated 2000-2025. Below are some key figures in the calculations. The diagram above shows the Fossil CO2 Emissions Per Capita and the Free Level of emissions (green). The wide straight red line shows emissions in the 1990s (baseline in the calculations).
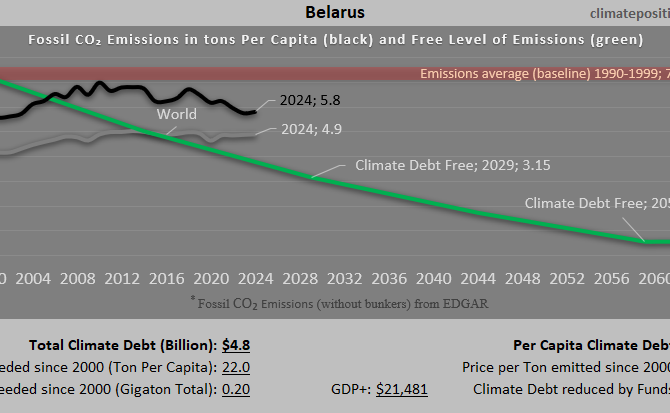
Climate Debt of Belarus 2025: $4.8 Billion or 0.05% of the Global Climate Debt (or $526 Per Capita)
/2025/ Belarus ranks 63rd in Climate Debt Per Capita accumulated 2000-2025. Below are some key figures in the calculations. The diagram above shows the Fossil CO2 Emissions Per Capita and the Free Level of emissions (green). The wide straight red line shows emissions in the 1990s (baseline in the calculations).
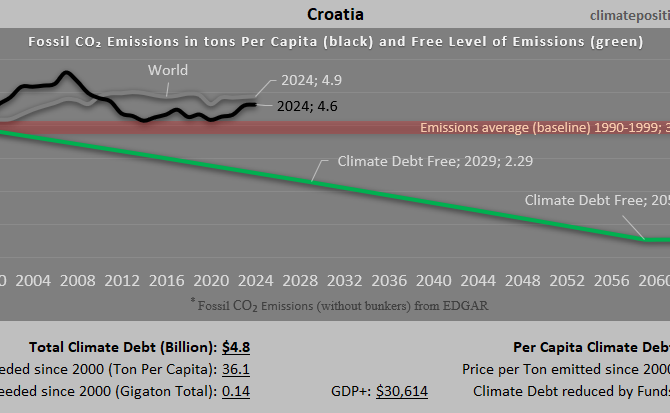
Climate Debt of Croatia 2025: $4.8 Billion or 0.05% of the Global Climate Debt (or $1229 Per Capita)
/2025/ Croatia ranks 46th in Climate Debt Per Capita accumulated 2000-2025. Below are some key figures in the calculations. The diagram above shows the Fossil CO2 Emissions Per Capita and the Free Level of emissions (green). The wide straight red line shows emissions in the 1990s (baseline in the calculations).