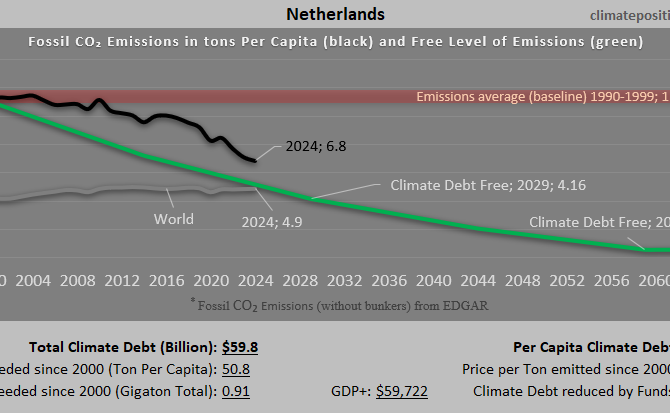
Climate Debt of Netherlands 2025: $60 Billion or 0.65% of the Global Climate Debt (or $3326 Per Capita)
/2025/ Netherlands ranks 19th in Climate Debt Per Capita accumulated 2000-2025. Below are some key figures in the calculations. The diagram above shows the Fossil CO2 Emissions Per Capita and the Free Level of emissions (green). The wide straight red line shows emissions in the 1990s (baseline in the calculations).
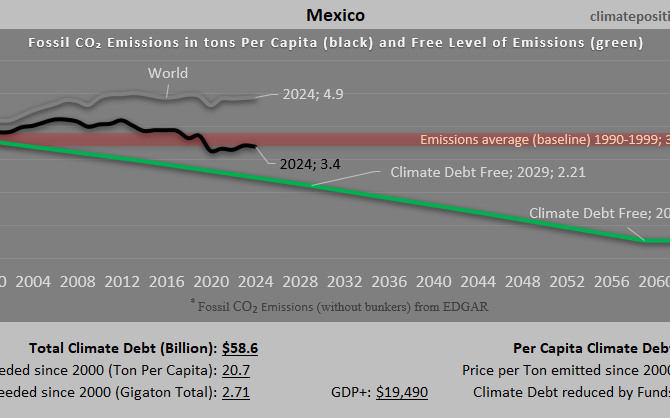
Climate Debt of Mexico 2025: $59 Billion or 0.63% of the Global Climate Debt (or $448 Per Capita)
/2025/ Mexico ranks 67th in Climate Debt Per Capita accumulated 2000-2025. Below are some key figures in the calculations. The diagram above shows the Fossil CO2 Emissions Per Capita and the Free Level of emissions (green). The wide straight red line shows emissions in the 1990s (baseline in the calculations).

Climate Debt of Oman 2025: $58 Billion or 0.63% of the Global Climate Debt (or $11018 Per Capita)
/2025/ Oman ranks 6th in Climate Debt Per Capita accumulated 2000-2025. Below are some key figures in the calculations. The diagram above shows the Fossil CO2 Emissions Per Capita and the Free Level of emissions (green). The wide straight red line shows emissions in the 1990s (baseline in the calculations).
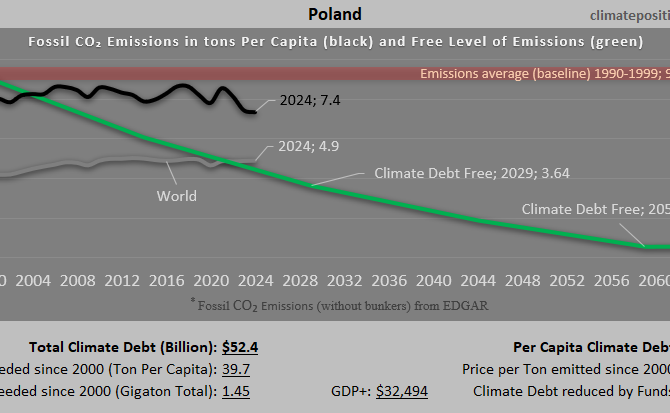
Climate Debt of Poland 2025: $52 Billion or 0.57% of the Global Climate Debt (or $1434 Per Capita)
/2025/ Poland ranks 41st in Climate Debt Per Capita accumulated 2000-2025. Below are some key figures in the calculations. The diagram above shows the Fossil CO2 Emissions Per Capita and the Free Level of emissions (green). The wide straight red line shows emissions in the 1990s (baseline in the calculations).

Climate Debt of France 2025: $50 Billion or 0.54% of the Global Climate Debt (or $731 Per Capita)
/2025/ France ranks 56th in Climate Debt Per Capita accumulated 2000-2025. Below are some key figures in the calculations. The diagram above shows the Fossil CO2 Emissions Per Capita and the Free Level of emissions (green). The wide straight red line shows emissions in the 1990s (baseline in the calculations).
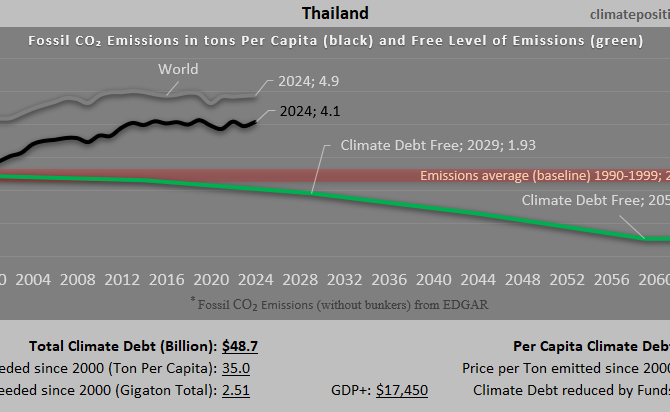
Climate Debt of Thailand 2025: $49 Billion or 0.53% of the Global Climate Debt (or $679 Per Capita)
/2025/ Thailand ranks 59th in Climate Debt Per Capita accumulated 2000-2025. Below are some key figures in the calculations. The diagram above shows the Fossil CO2 Emissions Per Capita and the Free Level of emissions (green). The wide straight red line shows emissions in the 1990s (baseline in the calculations).
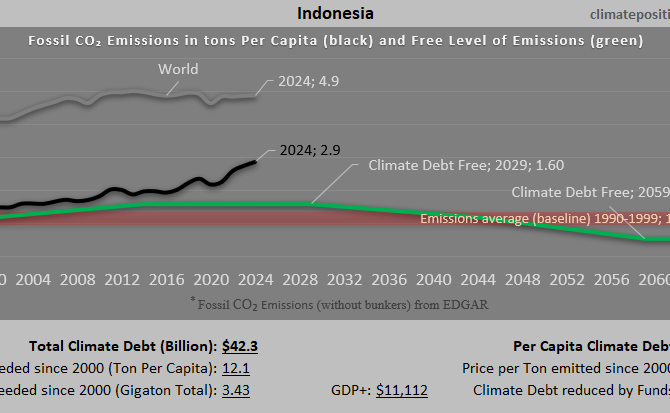
Climate Debt of Indonesia 2025: $42 Billion or 0.46% of the Global Climate Debt (or $149 Per Capita)
/2025/ Indonesia ranks 80th in Climate Debt Per Capita accumulated 2000-2025. Below are some key figures in the calculations. The diagram above shows the Fossil CO2 Emissions Per Capita and the Free Level of emissions (green). The wide straight red line shows emissions in the 1990s (baseline in the calculations).

Climate Debt of Brazil 2025: $35 Billion or 0.38% of the Global Climate Debt (or $167 Per Capita)
/2025/ Brazil ranks 78th in Climate Debt Per Capita accumulated 2000-2025. Below are some key figures in the calculations. The diagram above shows the Fossil CO2 Emissions Per Capita and the Free Level of emissions (green). The wide straight red line shows emissions in the 1990s (baseline in the calculations).
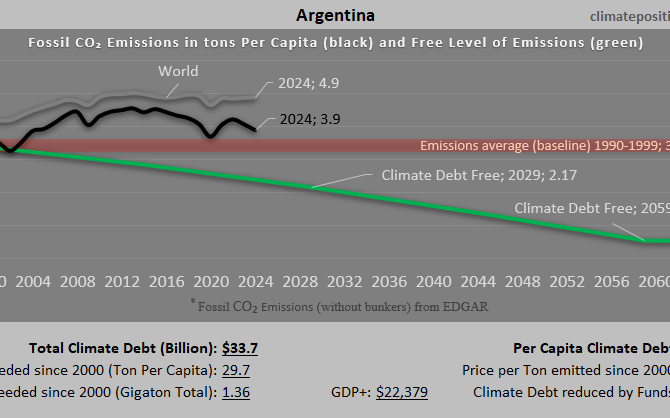
Climate Debt of Argentina 2025: $34 Billion or 0.36% of the Global Climate Debt (or $738 Per Capita)
/2025/ Argentina ranks 54th in Climate Debt Per Capita accumulated 2000-2025. Below are some key figures in the calculations. The diagram above shows the Fossil CO2 Emissions Per Capita and the Free Level of emissions (green). The wide straight red line shows emissions in the 1990s (baseline in the calculations).
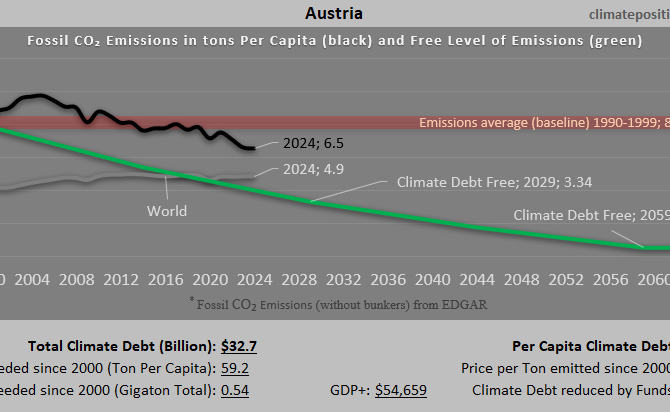
Climate Debt of Austria 2025: $33 Billion or 0.35% of the Global Climate Debt (or $3558 Per Capita)
/2025/ Austria ranks 18th in Climate Debt Per Capita accumulated 2000-2025. Below are some key figures in the calculations. The diagram above shows the Fossil CO2 Emissions Per Capita and the Free Level of emissions (green). The wide straight red line shows emissions in the 1990s (baseline in the calculations).
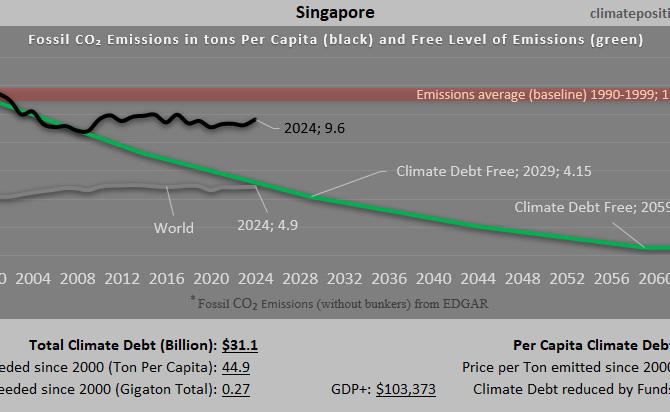
Climate Debt of Singapore 2025: $31 Billion or 0.34% of the Global Climate Debt (or $5152 Per Capita)
/2025/ Singapore ranks 15th in Climate Debt Per Capita accumulated 2000-2025. Below are some key figures in the calculations. The diagram above shows the Fossil CO2 Emissions Per Capita and the Free Level of emissions (green). The wide straight red line shows emissions in the 1990s (baseline in the calculations).
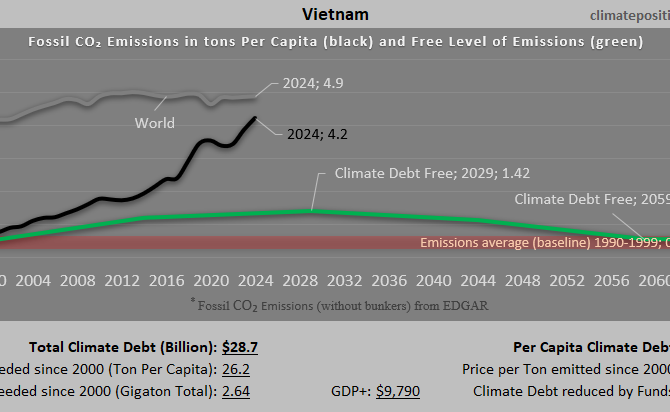
Climate Debt of Vietnam 2025: $29 Billion or 0.31% of the Global Climate Debt (or $285 Per Capita)
/2025/ Vietnam ranks 69th in Climate Debt Per Capita accumulated 2000-2025. Below are some key figures in the calculations. The diagram above shows the Fossil CO2 Emissions Per Capita and the Free Level of emissions (green). The wide straight red line shows emissions in the 1990s (baseline in the calculations).
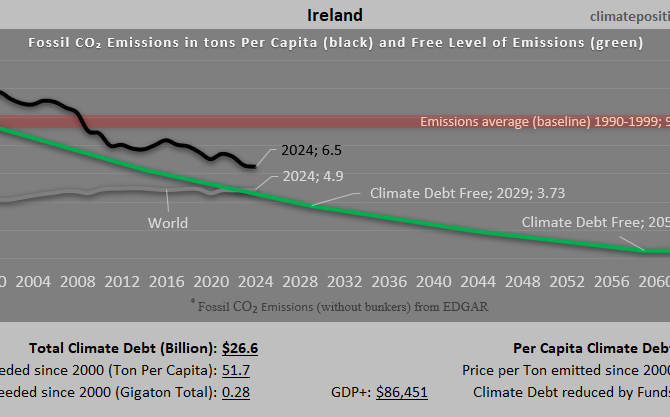
Climate Debt of Ireland 2025: $27 Billion or 0.29% of the Global Climate Debt (or $4935 Per Capita)
/2025/ Ireland ranks 16th in Climate Debt Per Capita accumulated 2000-2025. Below are some key figures in the calculations. The diagram above shows the Fossil CO2 Emissions Per Capita and the Free Level of emissions (green). The wide straight red line shows emissions in the 1990s (baseline in the calculations).
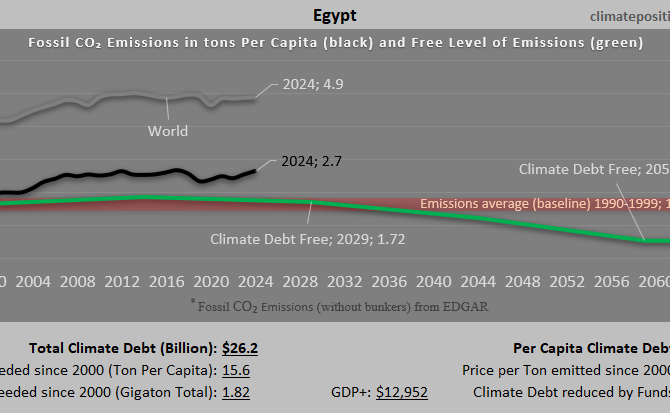
Climate Debt of Egypt 2025: $26 Billion or 0.28% of the Global Climate Debt (or $225 Per Capita)
/2025/ Egypt ranks 75th in Climate Debt Per Capita accumulated 2000-2025. Below are some key figures in the calculations. The diagram above shows the Fossil CO2 Emissions Per Capita and the Free Level of emissions (green). The wide straight red line shows emissions in the 1990s (baseline in the calculations).
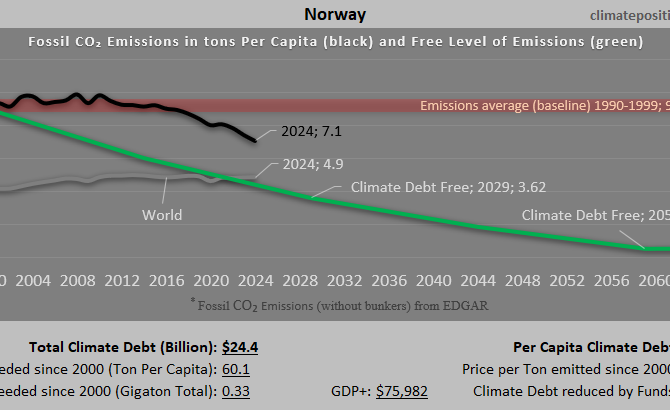
Climate Debt of Norway 2025: $24 Billion or 0.26% of the Global Climate Debt (or $4376 Per Capita)
/2025/ Norway ranks 17th in Climate Debt Per Capita accumulated 2000-2025. Below are some key figures in the calculations. The diagram above shows the Fossil CO2 Emissions Per Capita and the Free Level of emissions (green). The wide straight red line shows emissions in the 1990s (baseline in the calculations).
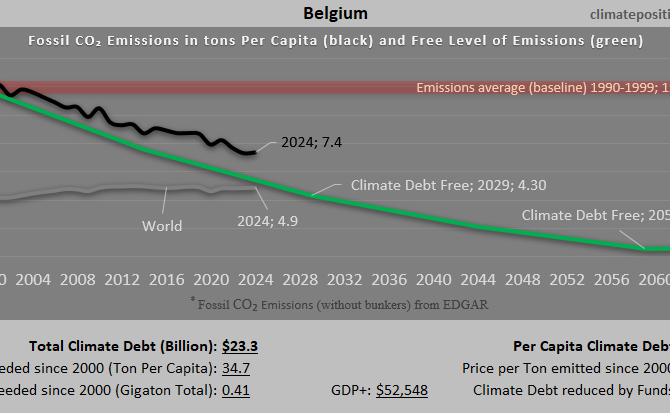
Climate Debt of Belgium 2025: $23 Billion or 0.25% of the Global Climate Debt (or $1971 Per Capita)
/2025/ Belgium ranks 30th in Climate Debt Per Capita accumulated 2000-2025. Below are some key figures in the calculations. The diagram above shows the Fossil CO2 Emissions Per Capita and the Free Level of emissions (green). The wide straight red line shows emissions in the 1990s (baseline in the calculations).
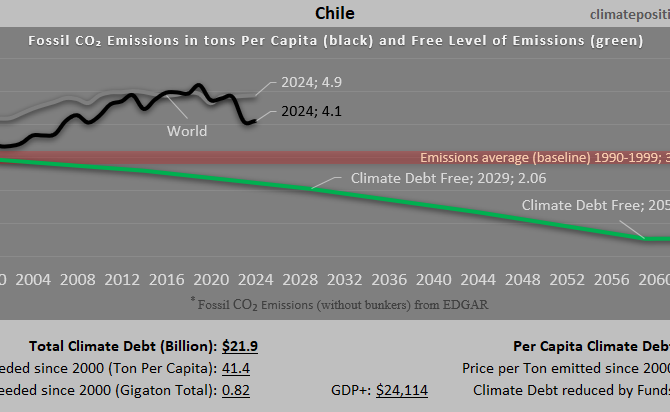
Climate Debt of Chile 2025: $22 Billion or 0.24% of the Global Climate Debt (or $1111 Per Capita)
/2025/ Chile ranks 48th in Climate Debt Per Capita accumulated 2000-2025. Below are some key figures in the calculations. The diagram above shows the Fossil CO2 Emissions Per Capita and the Free Level of emissions (green). The wide straight red line shows emissions in the 1990s (baseline in the calculations).
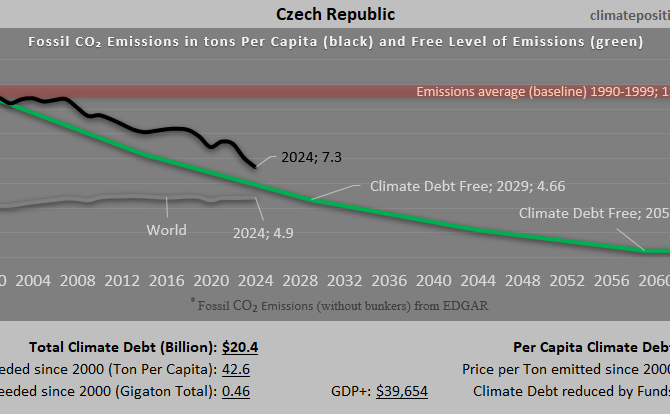
Climate Debt of Czech Republic 2025: $20 Billion or 0.22% of the Global Climate Debt (or $1874 Per Capita)
/2025/ Czech Republic ranks 32nd in Climate Debt Per Capita accumulated 2000-2025. Below are some key figures in the calculations. The diagram above shows the Fossil CO2 Emissions Per Capita and the Free Level of emissions (green). The wide straight red line shows emissions in the 1990s (baseline in the calculations).

Climate Debt of Algeria 2025: $18.2 Billion or 0.21% of the Global Climate Debt (or $409 Per Capita)
/2025/ Algeria ranks 68th in Climate Debt Per Capita accumulated 2000-2025. Below are some key figures in the calculations. The diagram above shows the Fossil CO2 Emissions Per Capita and the Free Level of emissions (green). The wide straight red line shows emissions in the 1990s (baseline in the calculations).
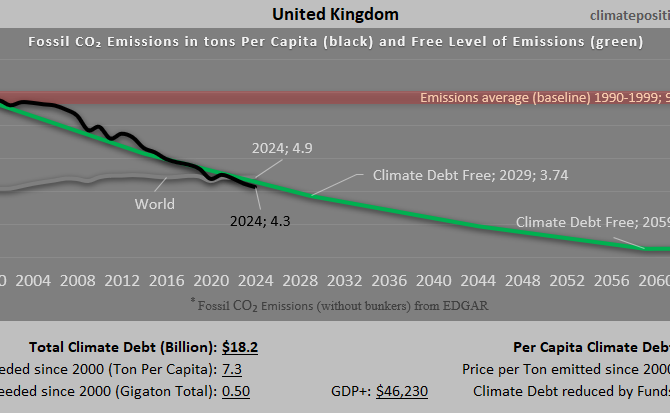
Climate Debt of United Kingdom 2025: $18.2 Billion or 0.20% of the Global Climate Debt (or $263 Per Capita)
/2025/ United Kingdom ranks 72nd in Climate Debt Per Capita accumulated 2000-2025. Below are some key figures in the calculations. The diagram above shows the Fossil CO2 Emissions Per Capita and the Free Level of emissions (green). The wide straight red line shows emissions in the 1990s (baseline in the calculations).