How green are the fossil fuel producers? (Correlation between fossil fuel production, CO2 Emissions, GDP and Climate Debt)

2015
Greenhouse gas emissions from burning of fossil fuels (oil, natural gas and coal), is the main cause of manmade climate change. Comparable energy potentials of oil, natural gas and coal is defined as “tons oil equivalents”, meaning that the energy released from a given quantity of natural gas or coal is equivalent to one ton of oil. This way the total production of fossil fuels can be expressed in a single figure (not to be confused with market value, global warming potential or general usefulness) The world’s production in million tons oil equivalent, was in 2013: oil (4,130), natural gas (3,041 and coal (3,881).
The table below ranks the twenty countries with the largest per capita fossil fuel production (oil equivalents). Total production data of 68 countries is from ‘BPs Statistical Review of World Energy 2014’ (pdf, 48 pages).
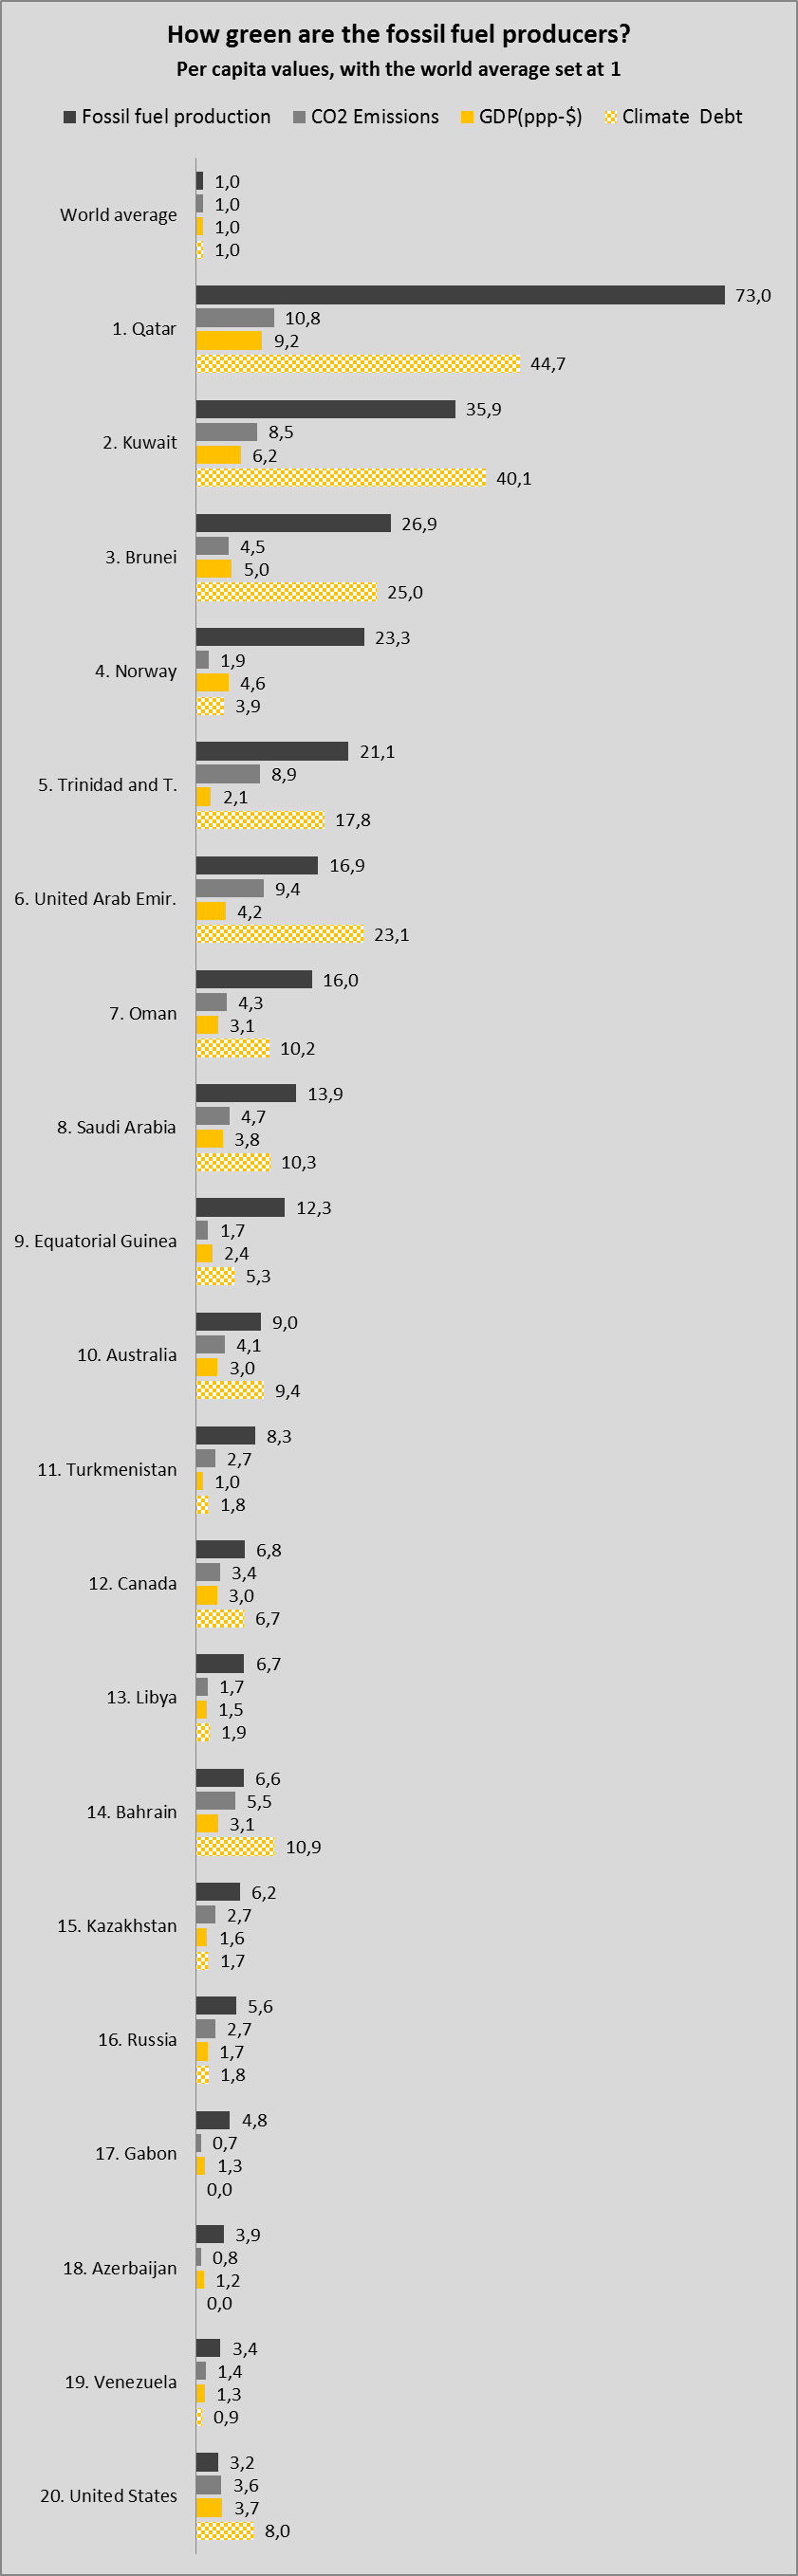
The table shows the correlation between:
- Per capita fossil fuel production (oil equivalents) in 2013 (ranked 1-20), with the world average set at 1.0.
- Per capita CO2 Emissions from fossil fuels in 2012, with the world average set at 1.0.
- Per capita GDP(ppp-$) in 2013, with the world average set at 1.0.
- Per capita Climate Debt (in ClimatePositions) in 2014, with the world average set at 1.0 (estimates of Brunei and Equatorial Guinea¹).
Read the table like this: The per capita fossil fuel production of Qatar is 73.0 times larger than the world average and the Climate Debt is 44.7 times larger. More comments below the table.
Fossil fuel reserves are planetary recourses which happen to be located in certain fortunate countries. Extraction and export is basically detached from domestic consumption. Qatar could have decided to export the entire oil production and spent the revenue on domestic prosperity and green transition – this would have left the small dictatorship without any Climate Debt in ClimatePositions. However, the ‘Qatari per capita CO2 Emissions’ from fossil fuels is 10.8 times larger than the world average and the Climate Debt is 44.7 times larger. Note that the size of the Climate Debt expresses the will and capability to positive changes since 2000 (read ‘more‘).
Qatar is an extreme representative of the overall trend among the 20 listed countries:
- 14 countries are also among the 20 countries² with the largest per capita CO2 Emissions.
- 11 countries are also among the 20 countries² with the largest per capita GDP(ppp-$).
- 13 countries are also among the 20 countries² with the largest per capita Climate Debt.
Among the 20 countries, only Gabon and Azerbaijan has no Climate Debt, while Venezuela’s is just below world average. All other countries on the list (85%) have a Climate Debt between 1.7 and 44.7 times the world average. The Climate Debt of an average country among the 20 is 11.2 times larger than the world average. However, Norway has managed to challenge the negative correlation: the huge Norwegian per capita fossil fuel production (rank 4) and the great economic wealth (rank 5) is achieved with more moderate CO2 Emissions (rank 26) and ditto Climate Debt (rank 16). Read this ‘article about Norway‘.
.
¹The indicator of Ecological Footprint is set at world average (in ClimatePositions) for Brunei and Equatorial Guinea.
²Out of 147 countries with full data in ClimatePositions plus Brunei and Equatorial Guinea.
.
The 20 listed fossil fuel producing countries represent 9% of the global population and their total accumulated Climate Debt amounts to more than $3,000 billion, or around 58% of the global Climate Debt. The total climate financing of the same countries amounts to only $0.4 billion, or 0.13% of their total Climate Debt (15 out of 20 countries have paid zero).
.
Data on production of oil, natural gas and coal (tons oil equivalents) is from BPs statistical review 2014: ‘http://www.bp.com/en/global/corporate/about-bp/energy-economics/statistical-review-of-world-energy.html‘. Per capita production 2013 is calculated by use of population data from: ‘http://www.gapminder.org/‘
Information on national GDP(ppp-$) per capita: Worldbank (links in the menu “Calculations”).
Source on CO2 Emissions: EIA, U.S. Energy Information Administration (links in the menu “Calculations”).
Data on national and global Populations 2013: ‘http://www.gapminder.org/data/‘.
Article about fossil fuel producers: ‘http://theenergycollective.com/robertwilson190/447121/who-produces-most-fossil-fuels‘
Article in The Guardian: ‘Saudi Arabia’s solar-for-oil plan is a ray of hope‘.
Source on climate change funding (financing) is from Climate Funds Update (links in the menu “Calculations”).
Collage/drawing (Shaikh on bicycle) by Claus Andersen, 2015.
Comments are closed.