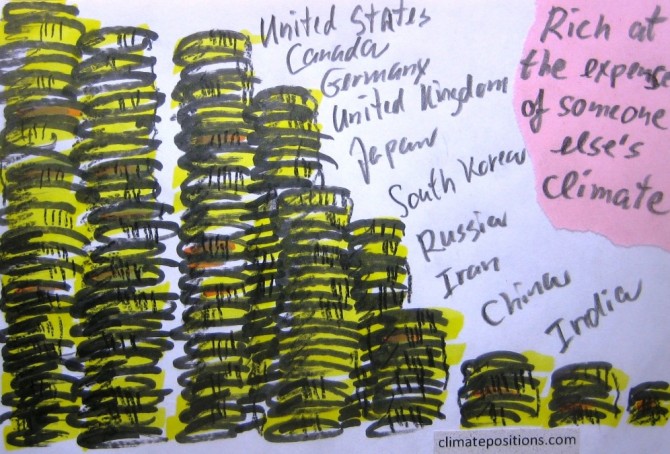
Climate Contributions as a percentage of GDP for the top ten CO2 Emitters
2013
The top ten CO2 Emitters were responsible for 67% of the global CO2 Emissions in 2006-2010. Adjusting the national Contributions (climate debt) for the size of the GDP(ppp-$) is essential. Allowing the wealthy United States get away with paying the same dollar price of a ton of CO2 (carbon dioxide) exceeded as China is of course absurd. The countries’ climate change performances are measured indirectly as the Contributions’ percentage of the national GDP(ppp-$).
Climate Change Performance Index 2013
2013
‘Climate Change Performance Index 2013’ is a ranking of 58 countries that was published recently by ‘Germanwatch’ and ‘Climate Action Network Europe’ – with the help of over 230 experts worldwide. 80% of the evaluation is based on indicators of emissions (30% for emissions levels and 30% for recent development of emissions), efficiency (5% level of efficiency and 5% recent development in efficiency) and renewable energy (8% recent development and 2% share of total primary energy supply). For the first time emissions from deforestation is included. The remaining 20% of the evaluation is based on national and international climate policy assessments by experts from the respective countries.
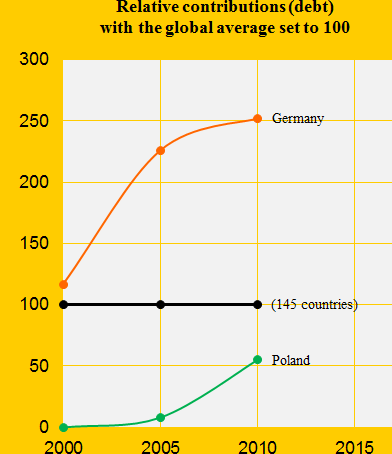
Climate performance: Germany versus Poland
2013
Germany was the 24th worst performing country out of 145 in ClimatePositions 2010 and Poland was the 46th. Five years earlier in 2005 the rankings were respectively 23th and 66th. The diagram shows the performance relatively with the global average set at 100. Germany has performed continuous irresponsible, though slightly less irresponsible in recent years and Poland seems to have given up all the good intentions around 2003. Below we highlight three of the national indicators in the calculations.

Putin’s Russia is deteriorating ecologically
2013
Russia was the world’s third largest CO2 Emitter (carbon dioxide) in 2006-2010 and the authoritarian regime was the 31st worst performing country in ClimatePositions 2010. In 2005 the ranking was 34th and in 2000 43rd. The negative development under Putin is unquestionable.
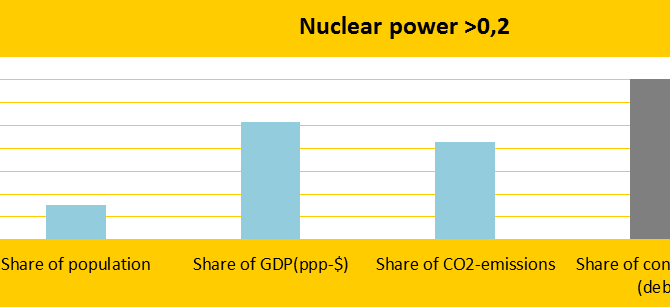
Nuclear Power countries fail on climate responsibility
2013
Seen as a group the top twenty Nuclear Power generating countries (kWh per capita) perform miserable on the climate change challenge. The diagram shows the twenty countries’ total share of the global: 1) Population (15.4%), 2) GDP(ppp-$) (51.5%), 3) CO2 emissions (42.9%) and 4) Contributions (70.6%). The nuclear power counts in calculations of the national Contributions (climate debt) as if the energy was produced with oil.

Questions and answers (6-9)
2013
Question 6: What can you do as a consumer?
Reductions in your consumption of fossil fuels, meat and unneeded items will contribute to limit climate change and ecological decline. Furthermore, you can buy organic (ecological) products if possible. Finally, you can prioritize products from Contribution Free countries and tend to choose products from the better performing countries in ClimatePositions (see the menu “Contributions/Per Capita US$ Rank”). Other important factors than ranking can of course influence your spending choices. Are you poor you can do very little or nothing.

Five Eyes Alliance is watching you
2013
Australia, Canada, New Zealand, United Kingdom and United States are secretly watching private mails, phone calls etc. worldwide – secretly until Snowden whistled. All five countries’ are defined as Full Democracies but the self-righteous surveillance activities take place in the closed Five Eyes Alliance (see ‘UKUSA Agreement‘ and ‘Echelon‘) with United States (read NSA) as Big Brother.

Updated climate change funding worldwide
2013
‘Climate Funds Update‘ is an independent website that provides information on international climate finance initiatives designed to help developing countries address the challenges of climate change. The site is a joint initiative of the ‘Heinrich Böll Stiftung‘ and the ‘Overseas Development Institute‘.