
Climate performance of Asia, the Americas and Europe
2014
83 countries out of 145 in ClimatePositions are located in Asia, the Americas or Europe. The 83 countries represent 82% of the included population and they are responsible for 88% of the Climate Contribution (climate debt). The 145 countries represent 96% of the global population. The following compares the climate performance of Asia, the Americas and Europe. Also read the posts on ‘Africa‘ and ‘Australia‘.

CO2 reduction targets worldwide
2014
Countless proposals have been launched during the years for the required reductions in CO2 Emissions. However, most of the suggested reduction targets have been empty statements and the overall scientific recommendations¹ are persistently being ignored by those in power. Meanwhile the global CO2 Emissions continue to increase (by 52% since 1990) and the worst case climate scenario is now unfolding.

United States: Republican states double up in CO2 Emissions compared to Democratic states
2014
The United States was responsible for 42.8% of the global Climate Contribution (climate debt) of $2,834 billion in ClimatePositions 2010. The US climate debt as an annual percentage of GDP(ppp-$) since 2000 was 0.82% (the global ranking was 11th; see ‘here’). How the rich and diverse country will finance its climate debt and reduce CO2 Emissions is of course a domestic issue. The following examines the CO2 Emissions and average Climate Contributions (climate debt) of 27 Democratic and 24 Republican states (the presidential election in 2012).
Miserable climate performance of Netherlands, Belgium and Luxembourg
2014
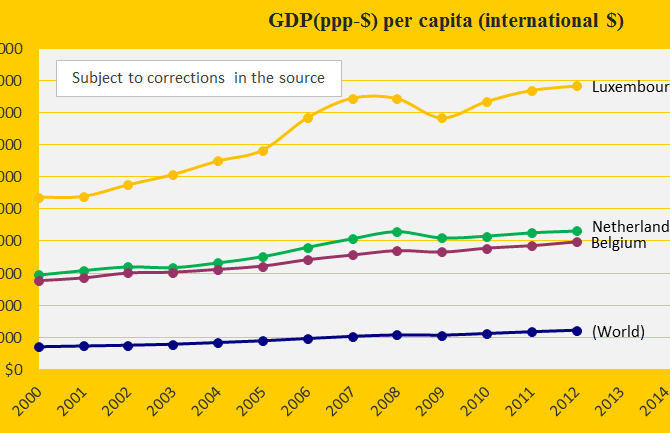
Netherlands and Belgium are rich countries and the little tax haven Luxembourg is extremely rich – see the diagram with the GDP(ppp) since 2000 compared with the world average. Netherlands and Belgium were 9th and 10th worst performing countries out of 145 in Climate Positions 2010. See the full ranking in the menu “Contributions / Per Capita US$ Rank”. Due to lack of data on Ecological Footprint Luxembourg is not included in the ranking. However, if the missing data is estimated at the same level as the neighboring countries, then Luxembourg would be 4th on the list. Together, the three countries are the vanguard of climate destruction in the European Union (EU).

Pisa scores, CO2 Emissions and climate debt
2014
510,000 15-year old students from 65 countries were Pisa tested and ranked in Mathematics, Reading and Science in 2012. The following compares the average Pisa scores with 1) CO2 Emissions per capita and 2) Increase in Climate Contributions (climate debt) since 2010. The question is this: Do the countries which successfully emphasize “clever students” also emphasize climate responsibility and reductions in CO2 Emissions? Or may the student’s impressive skills be aimed at other national goals, such as economic growth?