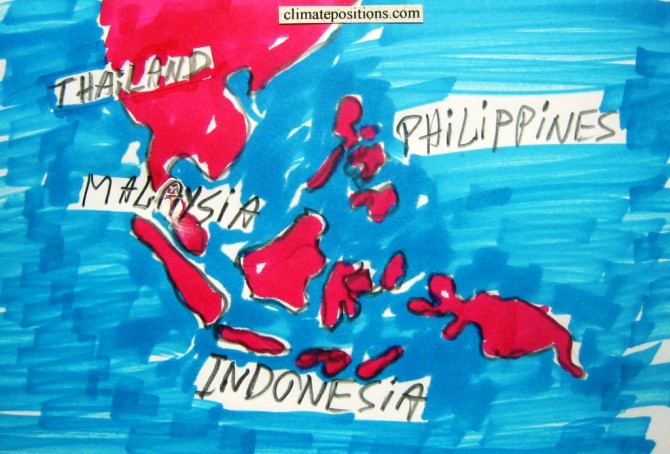
Climate change performance of Malaysia, Thailand, Indonesia and the Philippines
2015
6.4% of the world population lives in Malaysia, Thailand, Indonesia or the Philippines – they emitted 3.2% of the global carbon dioxide from fossil fuels in 2012. The four diagrams below show the emissions per capita 2000-2013 (preliminary estimates of 2013) of the four populous countries of which only the Philippines is Contribution Free (no climate debt) in ClimatePositions. The green bars are the Contribution Free Level of CO2 Emissions calculated from emissions in 1990s and a number of continuously updated ‘indicators’.

Polynomial projections of global warming 1880-2014 … 2130
2015
The global Land (air) Temperature of 2014 was the 4th warmest ever measured. Both the global Ocean (air) Temperature and the combined Ocean and Land Temperature of 2014 were the warmest ever measured (see ‘here‘).
A ‘polynomial projection’ (or polynomial interpolation) of temperature is neither a prediction nor a scientific scenario with certain assumptions. A polynomial projection reproduces data into the future in a sounder manner than a linear projection. The five diagrams below show the global Land (air) Temperature since 1880 with polynomial projections from 1980, 1990, 2000, 2010 and 2014 … projected by 2130. The red projection line start at 0°C in 1880 and the passing-years of 1°C, 2°C, 3°C etc. are marked. Read the comments below the diagrams.
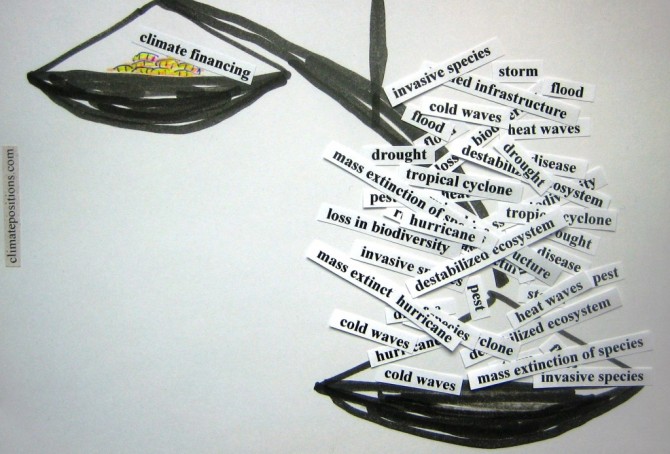
Climate finance to developing countries compared to climate debt by country
2015
The independent website ‘Climate Funds Update’ provides information on international climate finance initiatives designed to help developing countries address the challenges of climate change. By comparing the present climate funding (money deposited¹ by January 2015) to the accumulated national Climate Contributions (climate debt) in ClimatePositions the mismatch between climate debt and payments are exposed. The 82 countries in the table below are ranked by Climate Funding (financing) as percentage of the Climate Contributions … 48 of the countries have paid zero!
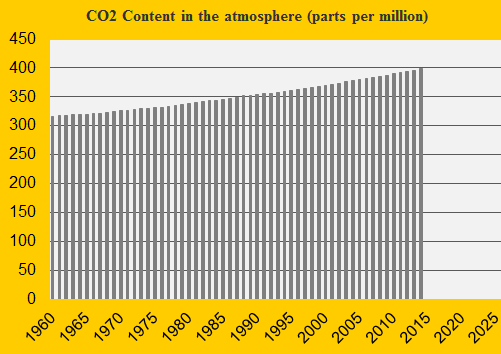
Update 2014 of the CO2 Content in the atmosphere
2015
The CO2 Content in the atmosphere measured in ppm (parts per million) set a new record in 2014 (as in all years in decades). In 2013 the content was 396.48 ppm and in 2014 it was 398.55 ppm – this updated figure is used in ClimatePositions.
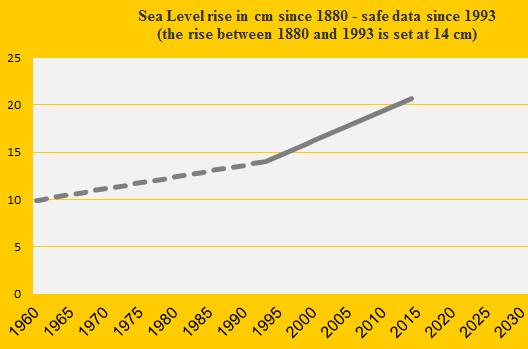
Sea Level update 2014
2015
The estimated global Sea Level increase rate is unchanged 0.32 cm annually since 1993. The increase between 1880 and 1993 is set at 14.00 cm. This adds up to a total Sea Level rise from 1880 to 2014 at 20.72 cm – this figure is used in ClimatePositions.
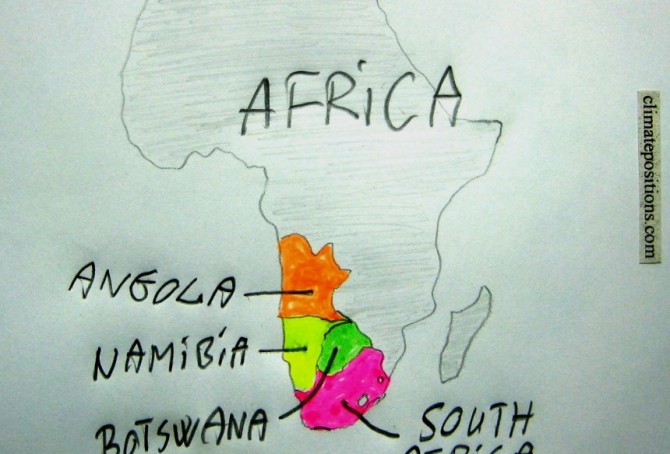
Climate change performance of South Africa, Botswana, Angola and Namibia
2015
36 out of 44 African countries in ClimatePositions are Contribution Free and the total climate debt of the African continent is 1.1% of the global climate debt – the share of the global population and CO2 Emissions from fossil fuels is respectively around 13.8% and 3.7%. The eight countries ranked below stand out in Africa by having a climate debt. This article analyses the performance of South Africa, Botswana, Angola and Namibia.