2024: Ranking updates now available (Global Climate Debt increases by 1.4 trillion dollars in two years)
/2024/ A new version of ClimatePositions Calculation Excel is now available in the menu. Updated rankings by country are also available in the menus.
In January 2024, the Global Climate Debt (accumulated since 2000) was 7.8 Trillion dollars, which is an increase of 700 Billion dollars annually since 2022. This reflects the tragic fact that global CO2 Emissions from Fossil Fuels were 6.7% higher in 2022 than in 2020.
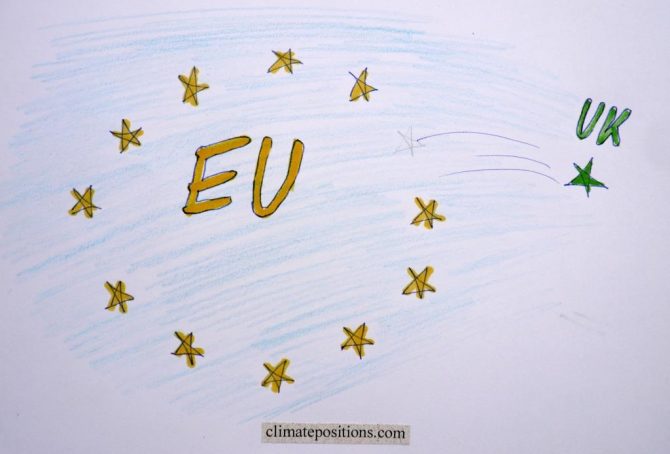
Climate change performance of the United Kingdom in comparison with the European Union
2016
Given that the United Kingdom (UK) has decided to leave the European Union (EU), the following examines the development of CO2 Emissions, Ecological Footprint, GDP(ppp-$) and Climate Debt of the UK in comparison with EU.
Between 1860 and 1890 the UK was the world’s largest greenhouse gas emitter and as late as 1966 the UK was still the 4th largest emitter. See this ‘Interactive timeline of the world’s top 20 emitters‘. When it comes to CO2 Emissions from fossil fuels (without bunker fuels) and cement production the UK was the world’s 15th largest emitter in 2014 (preliminary).
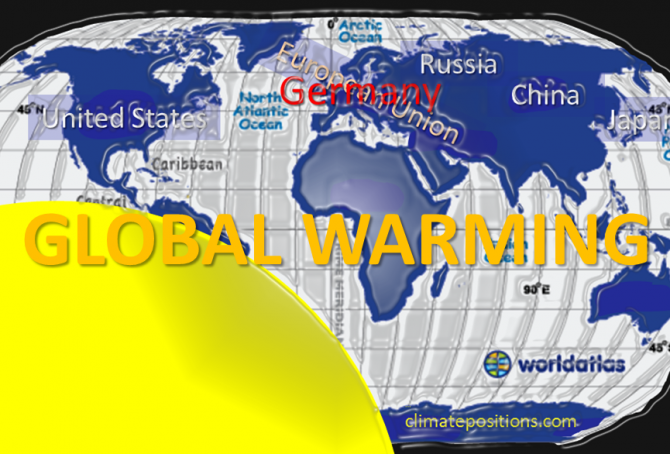
Climate Debt of Germany & the European Union … versus the United States, China, Japan and Russia
The Climate Debt of ‘the 28 member states of the European Union (EU-28)’, China, the United States, Japan and Russia, combined, amounts to nearly 70% of the world’s total Climate Debt of around $5,700 billion. The following compares 1) EU-28 with the four countries, 2) Germany with EU-28, and 3) Germany with the four other countries.
The table below shows the per capita Climate Debt, the total Climate Debt and the share of the global Climate Debt, of EU-28¹, China, the United States, Japan and Russia. Rankings of 148 countries by 2010 and January 2016 (preliminary estimates) are available in the menu “Climate Debt”.
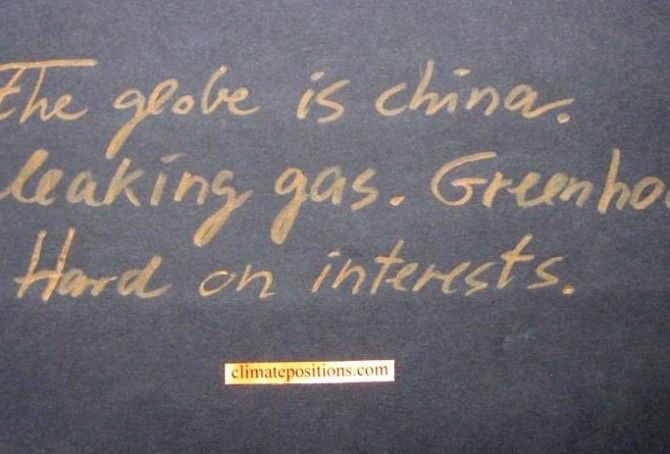
Giving up on future generations is real (about COP Submissions 2015)
2015
COP Submissions with intended national emission targets of 44 countries¹, responsible for 70% of the global CO2 Emissions from fossil fuels, are now available for study. Among the seven largest emitters only India’s submission is still missing. China, the world’s largest emitter, intends to reach its maximum emissions by 2030 (maybe earlier) and then reduce … which leaves global scenarios open to assumptions. The calculations in this article are based on 10% and 30% increase of the Chinese emissions by 2030, compared to 2013.

Climate change performance of Libya, Algeria, Tunisia and Morocco (refugees and the European Union)
2015
A devilish combination of poverty, armed conflict and violence in parts of Africa and Middle East, sends flows of refugees in boats across the Mediterranean Sea to Europe via Spain, Italy, Malta and Greece. In 2014 around 150,000 survived the dangerous trip to Italy alone. However, the European Union (EU) offers (as it seems) only a total of 5,000 resettlement places across Europe and the vast majority of all refugees will be sent back as irregular migrants. Read this ‘article’ from The Guardian.
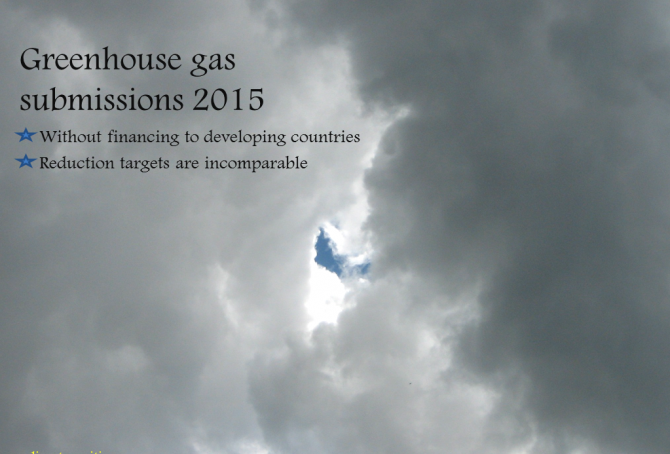
Greenhouse gas submissions of the United States, the European Union and Russia, by March 2015
Submissions of 33 countries (including ‘EU-28‘) with “intended nationally determined” greenhouse gas reductions have so far reached the United Nation’s ‘COP process website’. The greenhouse gas reductions proclaimed in the submissions include, besides carbon dioxide (CO2), gases such as methane, nitrous oxide, perfluorocarbons, hydrofluorocarbons, sulphur hexafluoride and nitrogen trifluoride – and changes in land-use and forestry. This mixture of different sources together with different parties, base years and target years, make the intended greenhouse gas reductions both muddy and incomparable between nations. None of the submissions so far include future financing to developing countries.
The following compares the submissions of the United States, the European Union (EU-28) and Russia – combined these 30 countries were responsible of 34% of the global carbon dioxide emissions from fossil fuels in 2012.
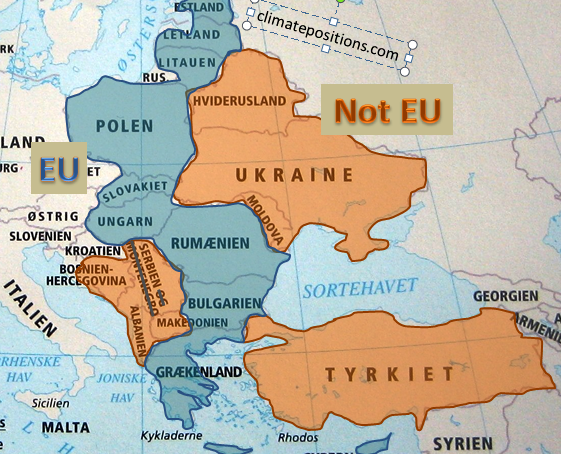
European Union “east” compared to bordering countries
2015
The ‘European Union’ (EU) is an economic and political partnership between ‘28 countries’. Around 7% of the global population lives in EU and they emit around 12% of the global CO2 from fossil fuels and are responsible of 13% of the Climate Debt in ClimatePositions. The following examines a group of 10 countries in eastern EU which joined the union between 1981 and 2007 in comparison with 8 bordering countries.
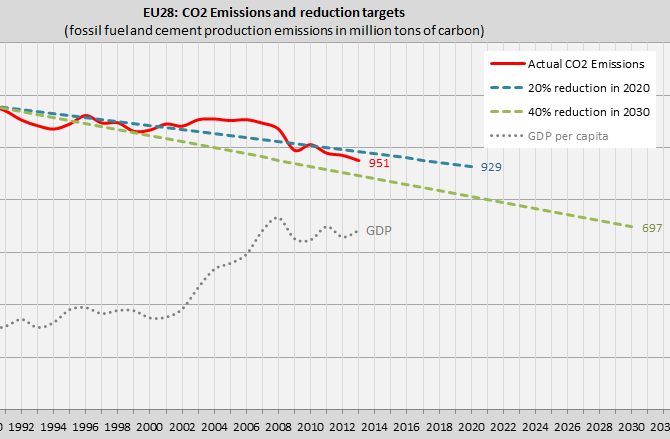
New greenhouse gas targets of the European Union: 40% reductions in 40 years
2014
The 28 countries in the European Union (EU) have recently decided three new greenhouse gas reduction targets of the EU by 2030 in comparison with 1990 levels:
- Binding reduction of greenhouse gas emissions by 40%.
- Binding increase of the share of renewable energy to 27% of the energy consumption.
- Indicative (optional) increase of energy efficiency by 27%.

Updated climate change funding worldwide
2013
‘Climate Funds Update‘ is an independent website that provides information on international climate finance initiatives designed to help developing countries address the challenges of climate change. The site is a joint initiative of the ‘Heinrich Böll Stiftung‘ and the ‘Overseas Development Institute‘.
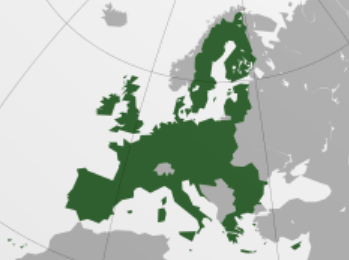
European Union perform poorly
2013
The map (from Wikipedia) shows the very different countries in ‘European Union‘ (EU). As a whole EU perform poorly on the climate challenge and only Romania was Contribution Free in ClimatePositions 2010. Both Netherlands and Belgium are among the top 10 worst performing countries in the world. Se the EU rank at the end and the global ranking in the menu “Contributions/Per Capita US$ Rank”).