Turkmenistan: Per Capita Climate Debt $1,507 (Ranked 40) – Fossil CO2 Emissions

In 2024, Turkmenistan is responsible for 0.12% of the Global Climate Debt accumulated since 2000. Below are some key figures in the calculations.
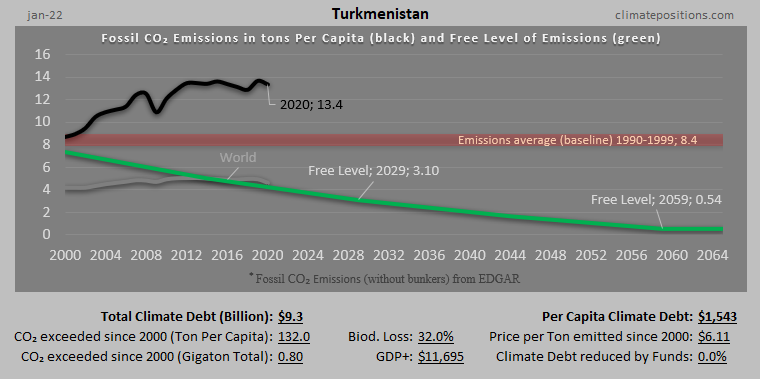

Turkmenistan – per capita Fossil CO2 Emissions and Climate Debt
2020
Turkmenistan’s current Climate Breakdown Pricing amounts to $12.37 per tons Fossil CO2 emitted since 2000. The Climate Debt grew from $1,300 per capita in 2015 to $2,799 in 2020. Updated Rankings of 165 countries are available in the menu “Climate Debt”.
The following diagrams expose the trends of Fossil CO2 Emissions, Climate Debt, GDP(ppp-$) and Ecological Footprint without carbon.
Uzbekistan – per capita Fossil CO2 Emissions and Climate Debt
2020
Uzbekistan’s current Climate Breakdown Pricing amounts to $1.20 per tons Fossil CO2 emitted since 2000. The Climate Debt grew from $43 per capita in 2015 to $93 in 2020. Updated Rankings of 165 countries are available in the menu “Climate Debt”.
The following diagrams expose the trends of Fossil CO2 Emissions, Climate Debt, GDP(ppp-$) and Environmental Performance.
Kazakhstan – per capita Fossil CO2 Emissions and Climate Debt
2020
Kazakhstan’s current Climate Breakdown Pricing amounts to $16.18 per tons Fossil CO2 emitted since 2000. The Climate Debt grew from $2,041 per capita in 2015 to $4,025 in 2020. Updated Rankings of 165 countries are available in the menu “Climate Debt”.
The following diagrams expose the trends of Fossil CO2 Emissions, Climate Debt, GDP(ppp-$) and Ecological Footprint without carbon.

Iran – per capita Fossil CO2 Emissions and Climate Debt
2020
Iran’s current Climate Breakdown Pricing amounts to $15.69 per tons Fossil CO2 emitted since 2000. The Climate Debt grew from $1,095 per capita in 2015 to $2,153 in 2020. Updated Rankings of 165 countries are available in the menu “Climate Debt”.
The following diagrams expose the trends of Fossil CO2 Emissions, Climate Debt, GDP(ppp-$), Ecological Footprint (without carbon) and Nuclear Power.
Share of global Climate Debt rank 40th, 41st and 42nd: Greece, Chile and Turkmenistan (combined responsible for 0.52% of Climate Debt and 0.64% of Fossil CO2 Emissions 2016)
2017
The diagram below shows ‘Share of global Climate Debt‘ in 2010, 2015 and 2017 of Greece, Chile and Turkmenistan (ranked 40th, 41st and 42nd). The share of Greece is decreasing, while the shares of Chile and Turkmenistan are increasing.
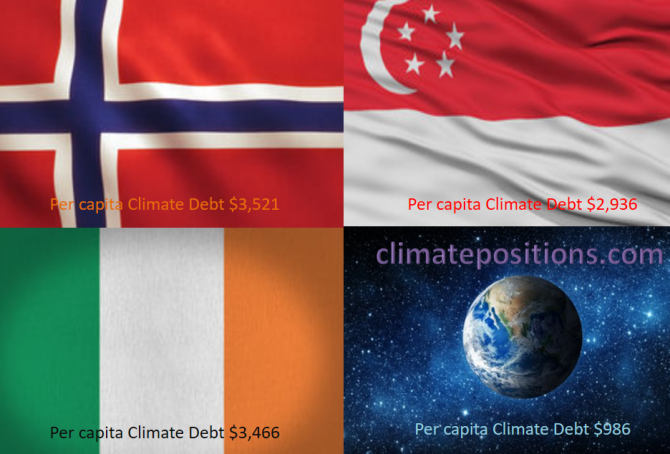
Share of global Climate Debt rank 37th, 38th and 39th: Norway, Ireland and Singapore (combined responsible for 0.71% of Climate Debt and 0.37% of Fossil CO2 Emissions 2016)
2017
The diagram below shows ‘Share of global Climate Debt‘ in 2010, 2015 and 2017 of Norway, Ireland and Singapore (ranked 37th, 38th and 39th). Norway’s share is decreasing, whereas Singapore’s is increasing. Ireland’s impressive decrease seems to have reversed lately.
Updated Climate Debt of 163 countries (per capita Fossil CO2 Emissions 1990-2016)
2017
National per capita CO2 Emissions from Fossil Fuels (without bunkers) and industrial processes in 2016 have been released by ‘EDGAR‘. At the same time, recalculated historic emissions have been released, which for some countries make a considerable difference¹ (also with regard to Climate Debt in ClimatePositions). The updated calculations are available in ‘Calculation (Excel)‘, and new rankings of 163 countries are available in the menu “Climate Debt”.
The table below shows World average, and the 15 countries with the largest per capita CO2 Emissions from Fossil Fuels and industrial processes in 2016, in tons, in comparison with average emissions 1990-1999, 2000-2009 and 2010-2015.

Global Carbon Project (CDIAC), located in the United States, stops publishing carbon emissions data by country – will be replaced by EDGAR in ClimatePositions
2017
The Carbon Dioxide Information Analysis Center (CDIAC), located at the U.S. Department of Energy’s (DOE) Oak Ridge National Laboratory, has published annual Carbon Emissions from Fossil Fuels and cement production by country since 1959 (‘Global Carbon Project‘), but now this continuous time series has come to an end and 2015 will be the last data-year (as it seems).
Since carbon emissions data from CDIAC (Global Carbon Project) is the core ‘Indicator‘ in ClimatePositions’ calculation of Climate Debt, carbon emissions data will be replaced with nearly similar data from ‘EDGAR‘ (‘European Commission‘ / ‘Climate Action‘), retroactively since 1990, in connection with the coming updates [done 16-08-2017].
The following describes the differences between CO2 Emissions data from Global Carbon Project (CDIAC) and EDGAR (sourced: European Commission, Joint Research Centre (JRC)/Netherlands Environmental Assessment Agency (PBL). Emission Database for Global Atmospheric Research (EDGAR)), and the consequences in terms of Climate Debt in ClimatePositions – illustrated with a range of country examples. Note that other sources, such as ‘IEA‘, ‘EIA‘ and ‘BP‘, provides CO2 Emissions data-sets different from the ones of CDIAC and EDGAR.

Climate change performance of Turkmenistan, Uzbekistan, Kyrgyzstan and Tajikistan
2015
0.7% of the global population lives in Turkmenistan, Uzbekistan, Kyrgyzstan or Tajikistan, and together they emitted 0.6% of the global CO2 from fossil fuels in 2012. Turkmenistan’s updated Climate Debt per capita is $1,394 and Uzbekistan’s is $84. Kyrgyzstan and Tajikistan are both Contribution Free (no Climate Debt). See the ‘ranking’ of 147 countries by November 2014. The following examines the CO2 Emissions (carbon dioxide from fossil fuels), GDP(ppp-$) and Climate Debt as a percentage of GDP.

How green are the fossil fuel producers? (Correlation between fossil fuel production, CO2 Emissions, GDP and Climate Debt)
2015
Greenhouse gas emissions from burning of fossil fuels (oil, natural gas and coal), is the main cause of manmade climate change. Comparable energy potentials of oil, natural gas and coal is defined as “tons oil equivalents”, meaning that the energy released from a given quantity of natural gas or coal is equivalent to one ton of oil. This way the total production of fossil fuels can be expressed in a single figure (not to be confused with market value, global warming potential or general usefulness) The world’s production in million tons oil equivalent, was in 2013: oil (4,130), natural gas (3,041 and coal (3,881).
The table below ranks the twenty countries with the largest per capita fossil fuel production (oil equivalents). Total production data of 68 countries is from ‘BPs Statistical Review of World Energy 2014’ (pdf, 48 pages).
Climate change performance of Turkmenistan, Kazakhstan and Uzbekistan
2014
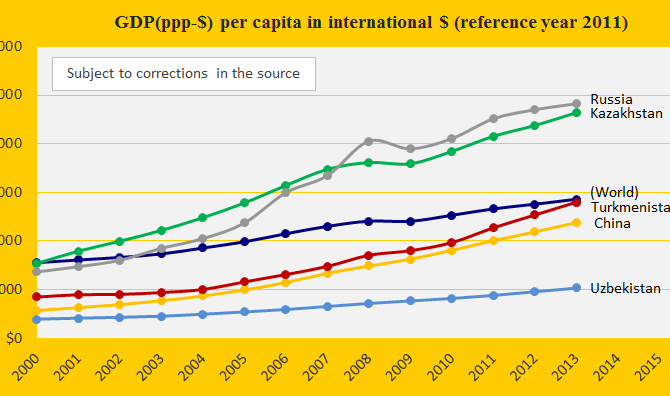
The three authoritarian regimes Turkmenistan, Kazakhstan and Uzbekistan were ranked respectively 31st, 40th and 71st on the worst performing list in ClimatePositions 2010. Their updated Climate Contributions (climate debt) are $1,043, $797 and $60 per capita. See the ranking ‘here’. The first diagram shows the GDP(ppp-$) per capita of the three neighboring countries located in the region Eurasia where the Middle East, Asia and Europe meet, in comparison with China, Russia and the world average.