Austria – per capita Fossil CO2 Emissions and Climate Debt
2020
Austria’s current Climate Breakdown Pricing amounts to $26.30 per tons Fossil CO2 emitted since 2000. The Climate Debt grew from $2,401 per capita in 2015 to $4,371 in 2020. Updated Rankings of 165 countries are available in the menu “Climate Debt”.
The following diagrams expose the trends of Fossil CO2 Emissions, Climate Debt, GDP(ppp-$) and Ecological Footprint without carbon.
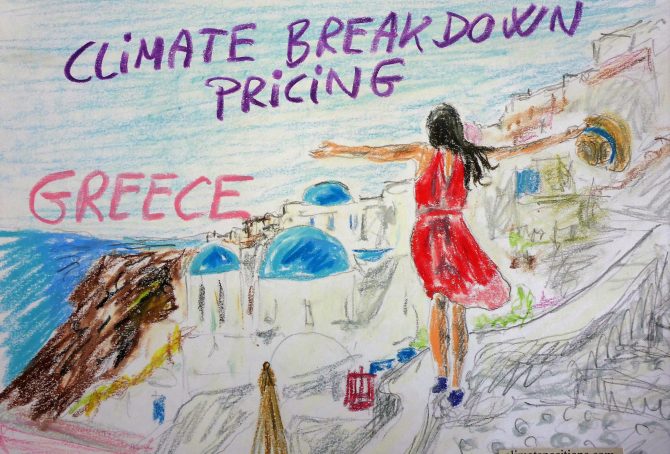
Greece – per capita Fossil CO2 Emissions and Climate Debt
2020
The current Climate Breakdown Pricing of Greece amounts to $12.76 per tons Fossil CO2 emitted since 2000. The Climate Debt grew from $1,256 per capita in 2015 to $1,929 in 2020. Updated Rankings of 165 countries are available in the menu “Climate Debt”.
The following diagrams expose the trends of Fossil CO2 Emissions, Climate Debt, GDP(ppp-$) and Ecological Footprint without carbon.
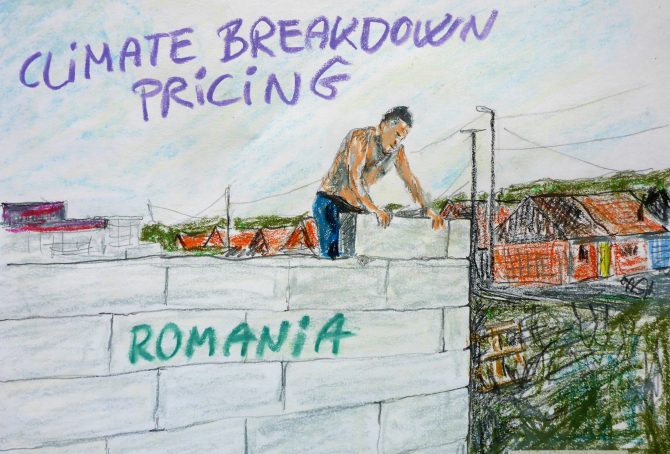
Romania – per capita Fossil CO2 Emissions and Climate Debt
2020
Romania’s current Climate Breakdown Pricing amounts to $2.78 per tons Fossil CO2 emitted since 2000. The Climate Debt grew from $65 per capita in 2015 to $235 in 2020. Updated Rankings of 165 countries are available in the menu “Climate Debt”.
The following diagrams expose the trends of Fossil CO2 Emissions, Climate Debt, GDP(ppp-$), Population Growth and Ecological Footprint without carbon.
Turkmenistan – per capita Fossil CO2 Emissions and Climate Debt
2020
Turkmenistan’s current Climate Breakdown Pricing amounts to $12.37 per tons Fossil CO2 emitted since 2000. The Climate Debt grew from $1,300 per capita in 2015 to $2,799 in 2020. Updated Rankings of 165 countries are available in the menu “Climate Debt”.
The following diagrams expose the trends of Fossil CO2 Emissions, Climate Debt, GDP(ppp-$) and Ecological Footprint without carbon.
Oman – per capita Fossil CO2 Emissions and Climate Debt
2020
Oman’s current Climate Breakdown Pricing amounts to $44.28 per tons Fossil CO2 emitted since 2000. The Climate Debt grew from $9,261 per capita in 2015 to $13,602 in 2020. Updated Rankings of 165 countries are available in the menu “Climate Debt”.
The following diagrams expose the trends of Fossil CO2 Emissions, Climate Debt, GDP(ppp-$), Population growth and Ecological Footprint without carbon.
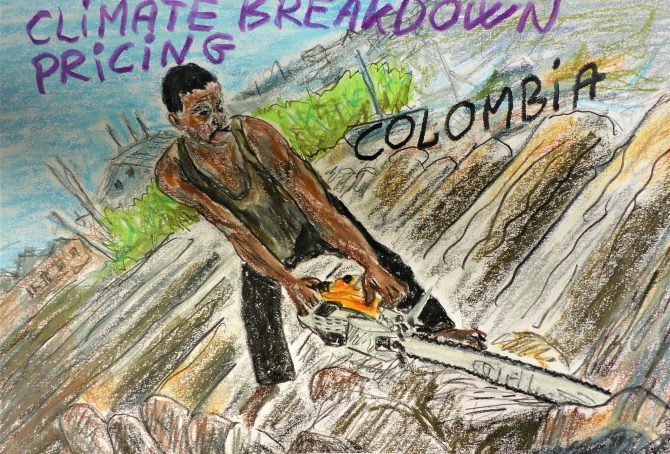
Colombia – per capita Fossil CO2 Emissions (zero Climate Debt)
2020
Although Colombia’s accumulated Climate Debt is zero, the country is the world’s 45th largest emitter of Fossil CO2.
The following diagrams expose the trends of Fossil CO2 Emissions, GDP(ppp-$), Forest Cover, Primary Forest and Environmental Performance.
Chile – per capita Fossil CO2 Emissions and Climate Debt
2020
Chile’s current Climate Breakdown Pricing amounts to $11.78 per tons Fossil CO2 emitted since 2000. The Climate Debt grew from $437 per capita in 2015 to $934 in 2020. Updated Rankings of 165 countries are available in the menu “Climate Debt”.
The following diagrams expose the trends of Fossil CO2 Emissions, Climate Debt, GDP(ppp-$), Forest Cover, Primary Forest and Ecological Footprint without carbon.
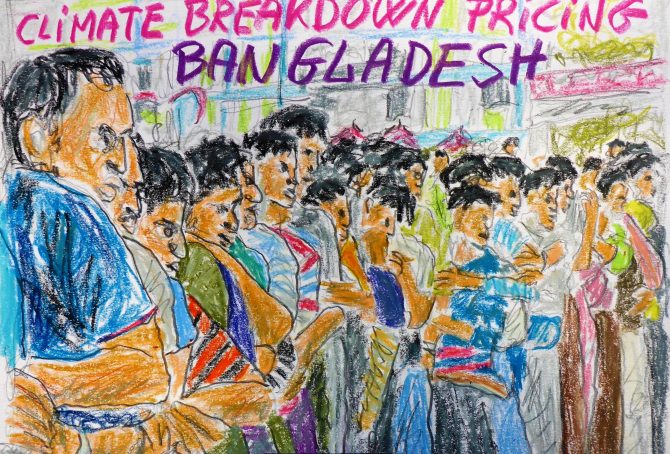
Bangladesh – per capita Fossil CO2 Emissions (zero Climate Debt)
2020
Although the accumulated Climate Debt of Bangladesh is zero, the populous country is the world’s 43rd largest emitter of Fossil CO2.
The following diagrams expose the trends of Fossil CO2 Emissions, GDP(ppp-$), Environmental Performance and Population.
Kuwait – per capita Fossil CO2 Emissions and Climate Debt
2020
Kuwait’s current Climate Breakdown Pricing amounts to $67.33 per tons Fossil CO2 emitted since 2000. The Climate Debt grew from $23,049 per capita in 2015 to $35,570 in 2020. Kuwait is the second most climate-criminal nation on the planet. Updated Rankings of 165 countries are available in the menu “Climate Debt”.
The following diagrams expose the trends of Fossil CO2 Emissions, Climate Debt, GDP(ppp-$) and Ecological Footprint without carbon.
Uzbekistan – per capita Fossil CO2 Emissions and Climate Debt
2020
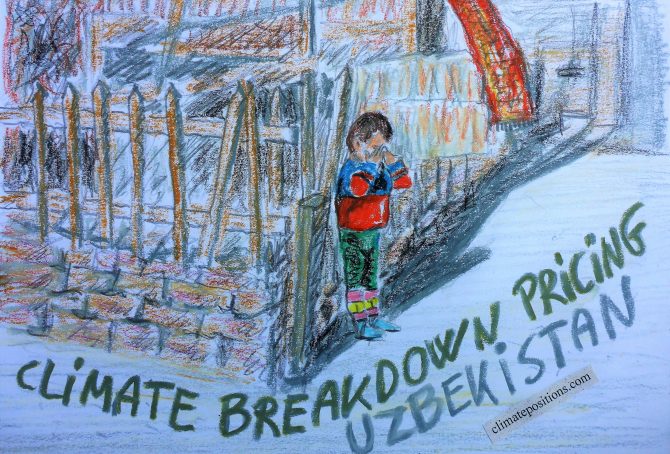
Uzbekistan’s current Climate Breakdown Pricing amounts to $1.20 per tons Fossil CO2 emitted since 2000. The Climate Debt grew from $43 per capita in 2015 to $93 in 2020. Updated Rankings of 165 countries are available in the menu “Climate Debt”.
The following diagrams expose the trends of Fossil CO2 Emissions, Climate Debt, GDP(ppp-$) and Environmental Performance.
Qatar – per capita Fossil CO2 Emissions and Climate Debt
2020
Qatar’s current Climate Breakdown Pricing amounts to $89.58 per tons Fossil CO2 emitted since 2000. The Climate Debt grew from $51,261 per capita in 2015 to $76,176 in 2020. Qatar is by far the most climate-criminal nation on the planet. Updated Rankings of 165 countries are available in the menu “Climate Debt”.
The following diagrams expose the trends of Fossil CO2 Emissions, Climate Debt, GDP(ppp-$) and Population.
Belgium – per capita Fossil CO2 Emissions and Climate Debt
2020
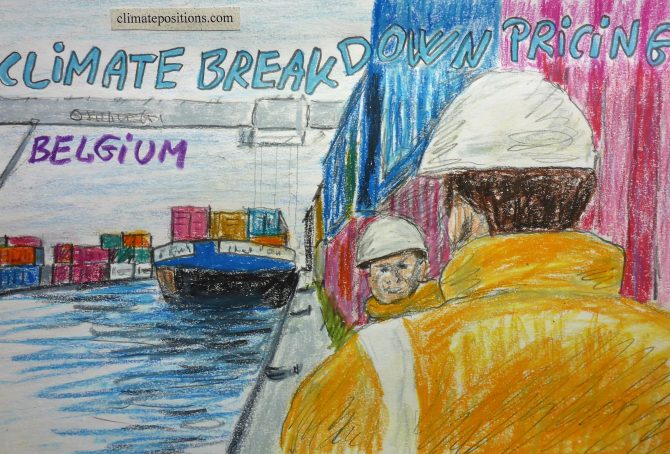
Belgium’s current Climate Breakdown Pricing amounts to $22.93 per tons Fossil CO2 emitted since 2000. The Climate Debt grew from $2,025 per capita in 2015 to $4,490 in 2020. Updated Rankings of 165 countries are available in the menu “Climate Debt”.
The following diagrams expose the trends of Fossil CO2 Emissions, Climate Debt, GDP(ppp-$), Nuclear Power and Ecological Footprint without carbon.
Nigeria – per capita Fossil CO2 Emissions (zero Climate Debt)
2020
Although Nigeria’s accumulated Climate Debt is zero, the populous country is the world’s 38th largest emitter of Fossil CO2.
The following diagrams expose the trends of Fossil CO2 Emissions, GDP(ppp-$), Environmental Performance, Forest Cover and Primary Forest.
Czech Republic – per capita Fossil CO2 Emissions and Climate Debt
2020
The current Climate Breakdown Pricing of Czech Republic amounts to $15.33 per tons Fossil CO2 emitted since 2000. The Climate Debt grew from $1,398 per capita in 2015 to $3,356 in 2020. Updated Rankings of 165 countries are available in the menu “Climate Debt”.
The following diagrams expose the trends of Fossil CO2 Emissions, Climate Debt, GDP(ppp-$) and Nuclear Power.
Venezuela – per capita Fossil CO2 Emissions and Climate Debt (economic collapse)
2020
Venezuela’s current Climate Breakdown Pricing amounts to $10.04 per tons Fossil CO2 emitted since 2000. The Climate Debt grew from $655 per capita in 2015 to $1,045 in 2020. However, once updated data on national GDP(ppp-$) is released, then the current Climate Debt will prove to be considerably smaller (more below). Updated Rankings of 165 countries are available in the menu “Climate Debt”.
The following diagrams expose the trends of Fossil CO2 Emissions, GDP(ppp-$), Climate Debt, Forest Cover, Primary Forest and Ecological Footprint without carbon.
Philippines – per capita Fossil CO2 Emissions (zero Climate Debt)
2020
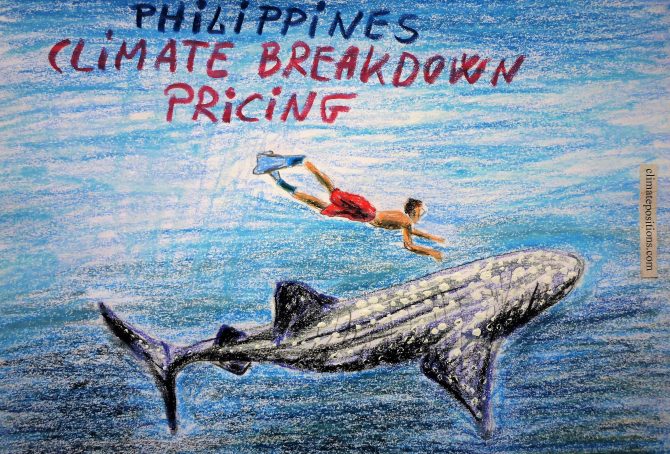
Although the accumulated Climate Debt of the Philippines is zero, the populous country is the world’s 35th largest emitter of Fossil CO2.
The following diagrams expose the trends of Fossil CO2 Emissions, GDP(ppp-$), Forest Cover, Primary Forest and Ecological Footprint without carbon.
The Netherlands – per capita Fossil CO2 Emissions and Climate Debt
2020
The current Climate Breakdown Pricing of the Netherlands amounts to $24.59 per tons Fossil CO2 emitted since 2000. The Climate Debt grew from $2,316 per capita in 2015 to $4,918 in 2020. Updated Rankings of 165 countries are available in the menu “Climate Debt”.
The following diagrams expose the trends of Fossil CO2 Emissions, Climate Debt, GDP(ppp-$) and Ecological Footprint without carbon.
Algeria – per capita Fossil CO2 Emissions and Climate Debt
2020
Algeria’s current Climate Breakdown Pricing amounts to $5.56 per tons Fossil CO2 emitted since 2000. The Climate Debt grew from $150 per capita in 2015 to $346 in 2020. Updated Rankings of 165 countries are available in the menu “Climate Debt”.
The following diagrams expose the trends of Fossil CO2 Emissions, Climate Debt, GDP(ppp-$) and Ecological Footprint without carbon.
Iraq – per capita Fossil CO2 Emissions and Climate Debt
2020
Iraq’s current Climate Breakdown Pricing amounts to $4.04 per tons Fossil CO2 emitted since 2000. The Climate Debt grew from $66 per capita in 2015 to $303 in 2020. Updated Rankings of 165 countries are available in the menu “Climate Debt”.
The following diagrams expose the trends of Fossil CO2 Emissions, Climate Debt, GDP(ppp-$) and Ecological Footprint without carbon.
Pakistan – per capita Fossil CO2 Emissions (zero Climate Debt)
2020
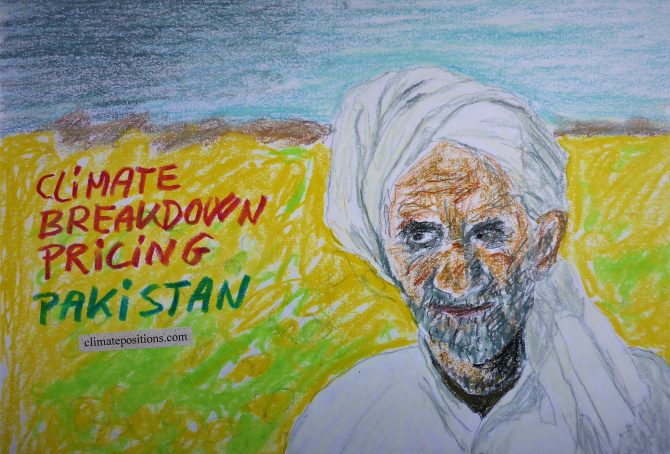
Although Pakistan’s accumulated Climate Debt is zero, the populous country is the world’s 32nd largest emitter of Fossil CO2.
The following diagrams expose the trends of Fossil CO2 Emissions, GDP(ppp-$), Environmental Performance and Ecological Footprint without carbon.

