Miserable climate performance of Netherlands, Belgium and Luxembourg
2014
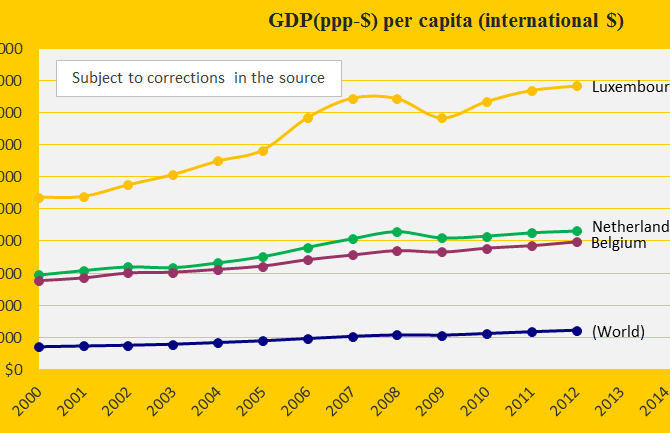
Netherlands and Belgium are rich countries and the little tax haven Luxembourg is extremely rich – see the diagram with the GDP(ppp) since 2000 compared with the world average. Netherlands and Belgium were 9th and 10th worst performing countries out of 145 in Climate Positions 2010. See the full ranking in the menu “Contributions / Per Capita US$ Rank”. Due to lack of data on Ecological Footprint Luxembourg is not included in the ranking. However, if the missing data is estimated at the same level as the neighboring countries, then Luxembourg would be 4th on the list. Together, the three countries are the vanguard of climate destruction in the European Union (EU).
Sweden with Nuclear Power and Norway with oilfields
2014
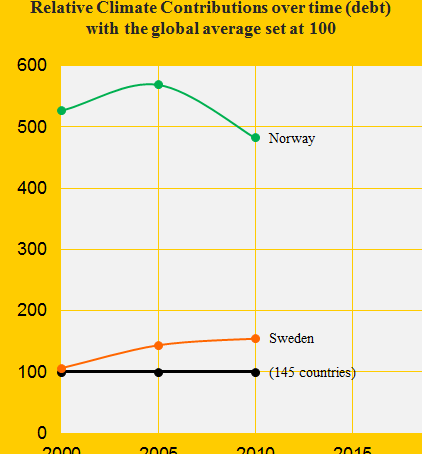
In ClimatePositions 2010, Norway was the 14th worst performing country – Sweden was number 30. See the relative Contributions per capita over time in the diagram. Norway, with only 0.07% of the world’s population, produces 2.80% of the world’s oil (crude extracted from reserves). In 2011, Norway was the world’s 14th largest oil producer. The neighboring country Sweden has no oil production but has the world’s largest Nuclear Power generation per capita.
The following examines the indicators: CO2 Emissions, Ecological Footprint, GDP(ppp-$) and Nuclear Power.

Putin’s Russia is deteriorating ecologically
2013
Russia was the world’s third largest CO2 Emitter (carbon dioxide) in 2006-2010 and the authoritarian regime was the 31st worst performing country in ClimatePositions 2010. In 2005 the ranking was 34th and in 2000 43rd. The negative development under Putin is unquestionable.
Nuclear Power countries fail on climate responsibility
2013
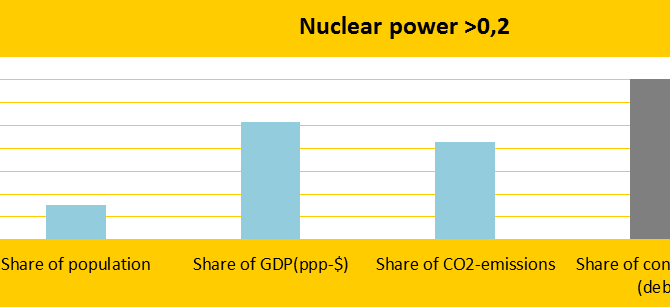
Seen as a group the top twenty Nuclear Power generating countries (kWh per capita) perform miserable on the climate change challenge. The diagram shows the twenty countries’ total share of the global: 1) Population (15.4%), 2) GDP(ppp-$) (51.5%), 3) CO2 emissions (42.9%) and 4) Contributions (70.6%). The nuclear power counts in calculations of the national Contributions (climate debt) as if the energy was produced with oil.
South Korea is going backwards in climate performance
2013
South Korea was the 15th worst performing country out of 145 in ClimatePositions 2010 with a Climate Contribution (climate debt) of $1,904 per capita. As shown in the front diagram the South Korean annual CO2 Emissions (carbon dioxide) have continued to increase in 2011 (12.5 tons per capita) and today the Contribution is $2,297 per capita. The updated calculations for all 145 countries are available in the submenu “Calculations (Excel)”.
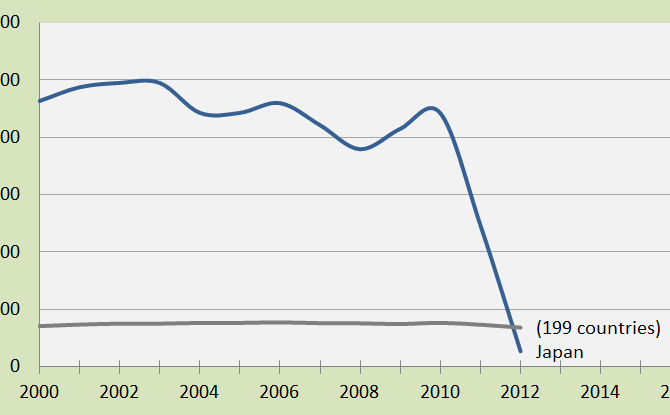
Nuclear Power shut down in Japan
2013
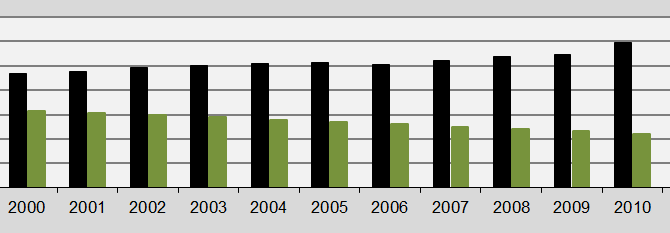
In 2010 Japan was the 3rd largest Nuclear Power producer, but after the tragic Fukushima nuclear disaster in March 2011, the country dropped to no. 18 in 2012. The diagram shows Japan’s Nuclear Power generation in kWh per capita 2000-2012. The grey line shows the global generation per capita.